
Last Updated: March 2, 2026
Introduction to Insulin Activities
Insulin and Metabolism
Insulin is a major metabolism regulating hormone secreted by β-cells of the islets of Langerhans of the pancreas. The major function of insulin is to counter the concerted actions of a number of hyperglycemia-generating hormones and to maintain low blood glucose levels. In addition to its role in regulating glucose metabolism, insulin stimulates lipogenesis, diminishes lipolysis, and increases amino acid transport into cells. Because there are numerous hyperglycemic hormones, untreated disorders associated with insulin generally lead to severe hyperglycemia and shortened life span.
Insulin as Growth Factor
Insulin also exerts activities typically associated with growth factors. Insulin is a member of a family of structurally and functionally similar molecules that includes the insulin-like growth factors (IGF-1 and IGF-2), and relaxin. The tertiary structure of all four molecules is similar, and all have growth-promoting activities. Insulin modulates transcription and stimulates protein translocation, cell growth, DNA synthesis, and cell replication, effects that it holds in common with the insulin-like growth factors and the reproductive hormone, relaxin.
Insulin Synthesis and and Processing
Insulin is synthesized as a preprohormone in the β-cells of the islets of Langerhans of the endocrine pancreas. Insulin is derived from the INS gene. The INS gene is located on chromosome 11p15.5 and is composed of 3 exons that generate four alternatively spliced mRNAs, all of which encode the same 110 amino acid preproprotein.
Like almost all secreted proteins, insulin is synthesized while being transferred into the lumen of the endoplasmic reticulum, ER. Following attachment to, and extrusion into, the lumen of the ER the signal sequence of the preproinsulin protein is removed. The proinsulin protein is packaged into secretory vesicles in the Golgi. Within these secretory vesicles the proprotein undergoes proteolysis to release the carboxy terminal A peptide, the amino terminal B peptide, and the C peptide which represents the central third of the proprotein. The A and B peptides are then folded into the native structure of functional insulin by the formation of two disulfide bonds between these two peptides.
Insulin Secretion
As indicated, the insulin proprotein is packaged into secretory vesicles (insulin-secretion granules) in the Golgi along with the protease required for its maturation. Within the Golgi the proinsulin protein is folded into its native structure which is stabilized by intrachain disulfide bonds. The protease that processes proinsulin is proprotein convertase subtilisin/kexin type 1 (PCSK1) which is encoded by the PCSK1 gene. PCSK1 is also referred to as prohormone convertase 1/3 (PC1/3). PCSK1 cleaves proinsulin to remove its connecting C-peptide which liberates the disulfide bonded A and B peptides that constitutes functional insulin.
Genetics of Pancreatic β-Cell Function and Insulin Secretion
As discussed in the following sections, there are numerous metabolic processes and metabolites that serve to regulate pancreatic β-cell insulin secretion, with glucose metabolism being the most significant. Numerous studies, such as genome-wide association studies (GWAS), have identified significance to the expression of numerous gene related to β-cell function and insulin secretion. Indeed, polymorphisms in many of these same genes have been identified by GWAS as being associated with abnormal β-cell function leading to reduced insulin synthesis and release typified in type 1 and type 2 diabetes.
Many genes, whose encoded proteins are involved in signal transduction processes, are involved in the regulation of insulin secretion in response to glucose metabolism. These genes include, but is not limited to, TCF7L2 (), GIPR (glucose-dependent insulinotropic peptide receptor), IGFBP2 (insulin-like growth factor binding protein 2), P2RY1 (P2Y1 receptor), HNF1A (hepatocyte nuclear factor 1α), HNF4A (hepatocyte nuclear factor 4α), GLIS3 (GLIS family zinc finger 3), and PTCH1 (patched 1). HNF-4α is a member of the nuclear receptor family of transcription factors, specifically identified as NR2A1. Mutations in the HNF1A gene are the cause of the most common form of maturity onset type diabetes of the young, MODY3. Mutations in the NHF4A gene are the cause of MODY1. The identification of GLIS3 refers to the fact that the gene encodes a protein that is the third member of a family of genes that are similar to the GLI (glioma-associate oncogene). The PTCH1 encoded protein is a receptor for the sonic hedgehog (SHH) growth factor.
Genes encoding membrane transporters are also critical to the normal responses of β-cells to glucose metabolism including KCNJ8 (Kir6.1), KCNJ11 (Kir6.2), KCNQ1 (Kv7.1), SLC39A11 (zinc transporter), SLC30A8, and SLC22A18. The KCNJ11 encoded transporter forms the core of the ATP-sensitive K+ channel responsible for regulated secretion of insulin. SLC30A8 encodes the zinc efflux transporter identified as ZnT8. ZnT8 autoantibodies are common in type 1 diabetes. The SLC22A18 gene is found in the imprinted region of chromosome 11 associated with Beckwith-Wiedemann syndrome (BWS)
As might be expected, numerous genes encoding metabolic enzyme and metabolic enzyme regulating proteins have also been found to be associated with normal β-cell function. Some of these genes include LDHB (lactate dehydrogenase B), LIPH, ACSL1 (acyl-CoA synthetase long-chain family member 1), G6PC2 (glucose-6-phosphatase family), and CAMK2B (Ca2+/calmodulin-dependent kinase IIβ). The LIPH gene encodes the lipase identified as membrane-associated phospholipase A1-beta (mPA-PLA1β). The LIPH encoded lipase is a member of the triglyceride lipase subfamily of the PLA1 family. LIPH generates 2-acyl lysophosphatidic acid (lysoPA as well as LPA) which is a ligand for the LPA6 receptor, a receptor that is related to the P2Y family of receptors. Although the G6PC2 gene is expressed in pancreatic islets, the encoded protein does not possess glucose-6-phosphatase activity.
Role of Sphingolipids in Insulin Processing
Increased circulating and intracellular lipids, such as diglycerides, cholesterol esters, and sphingolipids, has been implicated in causing effects in various tissues that, in combination, lead to the clinical manifestations of diabetes. It has also been well established that the processing of proinsulin to functional insulin in pancreatic β-cells is defective in both type 1 diabetes and type 2 diabetes.
Evidence has shown that in diabetes there is an associated accumulation of numerous different lipid species within the pancreatic β-cells. One species of sphingolipid in particular has been found at increased levels in diabetic β-cells identified as C16:0 ceramide (C16:0 Cer) where the 16:0 denotes the saturated fatty acid, palmitic acid. The synthesis of ceramides involves a family of six enzymes called ceramide synthases (CerS). The synthesis of C16:0 Cer can be accomplished via the action of CerS5 or CerS6. In contrast to lipid increases, ceramides containing very long-chain fatty acids (>24 carbon atoms) are decreased in the pancreas of diabetics. The generation of these latter ceramides is carried out by CerS2. Expression of the CerS2 encoding gene in humans is the highest of all the CerS genes in human pancreatic β-cells.
In experimental animals, knocking out the CERS2 gene results in approximately 70% reduction in insulin release following a glucose bolus injection. These data demonstrate that CerS2 plays a critical role in glucose-stimulated insulin secretion (GSIS). One of the mechanisms by which CerS2 ablation impairs GSIS is through reduction in the level of the protease, PCSK1, responsible for processing proinsulin to functional insulin. The reductions in PCSK1 levels, as a result of CerS2 ablation, are due to impaired processing of the pro-PCSK1 protein which normally occurs as it transits from the endoplasmic reticulum (ER) to the Golgi.
Role of Potassium Channels in Insulin Secretion
Insulin secretion from β-cells is principally regulated by plasma glucose levels. Increased uptake of glucose by pancreatic β-cells leads to a concomitant increase in metabolism. In initial animal studies, that elucidated the role of glucose metabolism in insulin secretion, the rodent GLUT2 transporter was identified as the major sensor and transporter of glucose in pancreatic β-cells. However, in human pancreatic β-cells it is the GLUT1 and GLUT3 transporters that are responsible for glucose sensing and transport into the cells.
The increase in metabolism leads to an elevation in the ATP/ADP ratio. This in turn leads to the inhibition of an ATP-sensitive potassium channel (KATP channel). The net result is a depolarization of the cell leading to the opening of voltage-gated calcium channels (L-type Ca2+ channels) and Ca2+ influx into the β-cell. The influx of Ca2+ stimulates insulin-secretion granule fusion with the plasma membrane resulting in insulin secretion.
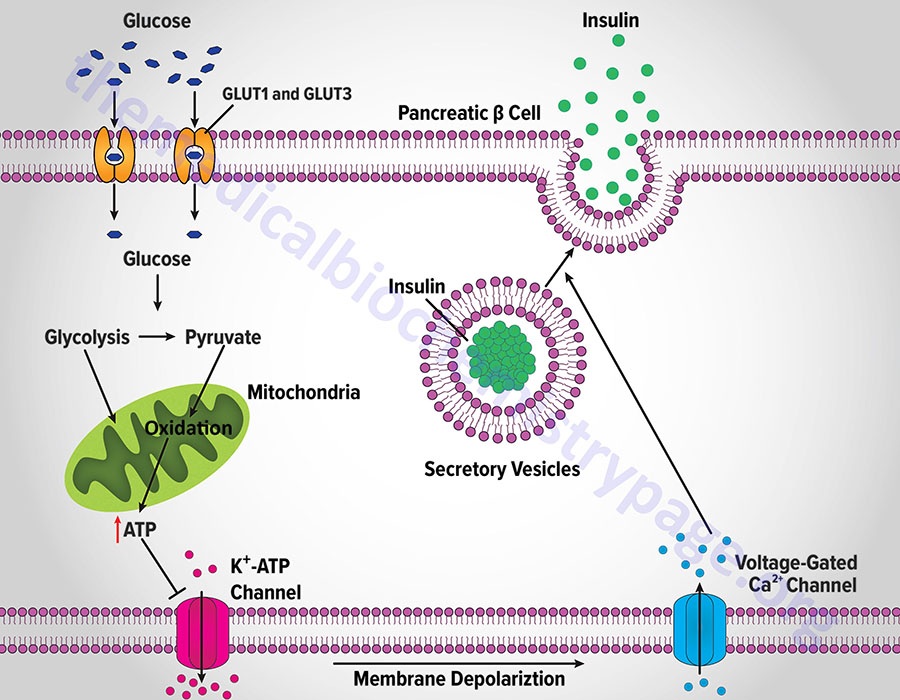
Although glucose is the major fuel whose oxidation leads to energy-coupled insulin secretion, a process referred to as glucose-stimulated insulin secretion (GSIS), there are other means for stimulated insulin secretion. One important process is referred to as the pyruvate cycle and involves coupling of amino acid metabolism to insulin secretion. The insulin secreting β-cells, in contrast to the liver, do not express the gluconeogenic enzyme phosphoenolpyruvate carboxykinase (PEPCK) but do express robust levels of the gluconeogenic enzyme pyruvate carboxylase (PC). Coupled with the activity of PC is the activity of malic enzyme which together, is the only means for pyruvate cycling in β-cells.
Pancreatic β-Cell Potassium Channel
The KATP channel is a complex of 8 polypeptides comprising four copies of the protein encoded by the ABCC8 (ATP-binding cassette, sub-family C, member 8) gene and four copies of the protein encoded by the KCNJ11 (potassium inwardly-rectifying channel, subfamily J, member 11) gene. The ABCC8 encoded protein is also known as the sulfonylurea receptor (SUR). The KCNJ11 encoded protein forms the core of the KATP channel and is called Kir6.2.
The KCNJ11 gene is located on chromosome 11p15.1 and is composed of 4 exons that generate four alternatively spliced mRNAs that collectively encode two protein isoforms. Isoform 1 is 390 amino acids and isoform 2 is 303 amino acids.
Mutations in the KCNJ11 gene are associated with MODY13, transient neonatal diabetes mellitus type 3 (TNDM3), permanent neonatal diabetes mellitus (PNDM), familial persistent hyperinsulinemic hypoglycemia of infancy (PHHI), and also contributes to an autosomal dominant form of type 2 diabetes.
The ABCC8 gene is also located on chromosome 11p15.1 and is composed of 38 exons that generate five alternatively spliced mRNAs, each of which encodes a distinct protein isoform. Mutations in the ABCC8 gene are also associated with an autosomal dominant form of type 2 diabetes and with an autosomal recessive disorder termed hyperinsulinemic hypoglycemia of infancy. As might be expected, the role of KATP channels in insulin secretion presents a viable therapeutic target for treating hyperglycemia due to insulin insufficiency as is typical in type 2 diabetes.
Pancreatic β-Cell Calcium Channels
The calcium channels in the plasma membrane of pancreatic β-cells belong to the voltage-gated calcium channel family. The voltage-gated calcium channels (also called voltage-dependent calcium channels, VDCC) are divided into three distinct families, each with multiple members. These channel families are termed the Cav1.x, Cav2.x, and Cav3.x families. The Cav1.x and Cav2.x families represent the high voltage activated (HVA) channels while the Cav3.x family represents the low voltage activated (LVA) family.
The Cav1.x channels are commonly referred to as L-type calcium channels. The Cav2.x channels are commonly called the P/Q-type (Cav2.1), N-type (Cav2.2), and R-type (Cav2.3) calcium channels. The Cav3.x channels are commonly referred to as the T-type calcium channels.
Nearly all of the voltage-gated calcium channels are pentameric structures composed of five different protein subunits identified as the α1-, α2-, β-, γ, and δ-subunits. Some voltage-gated calcium channels are composed of only four subunits and lack the γ subunit. These latter four subunit channels are typical of cardiac voltage-gated calcium channels. The α1-subunit is the actual transmembrane channel through which the Ca2+ ions flow. At least six Cavα1 subunits, including Cav1.2, Cav1.3, Cav2.1, Cav2.2, Cav2.3, and Cav3.1, have been identified in pancreatic β-cells.
The primary type of calcium channels in pancreatic β-cells that are responsible for insulin secretion are the L-type calcium channels. The significance of these voltage-gated calcium channels to the normal function of pancreatic β-cells and to the development of diabetes is demonstrated by the fact that dysregulation of their function is a significant contributor to type 1 and type 2 diabetes. Mutations in the gene (CACNA1C) encoding Cav1.2 (L-type) are associated with excessive insulin secretion. Trinucleotide repeat expansion in the genes (CACNA1D and CACNA1A) encoding Cav1.3 (L-type) and Cav2.1 (P/Q type), respectively, has been identified in a subgroup of patients with type 2 diabetes.
Role of Malic Enzymes in Insulin Secretion
Cytoplasmic malic enzyme plays an important role in acetyl-CoA transport from the mitochondria to the cytosol for its use in lipid biosynthesis. Human cells express both cytoplasmic and mitochondrial versions of malic enzyme. The role of the mitochondrial malic enzyme is principally to provide the cell with an alternate source of pyruvate under conditions where glycolytic flux in reduced. In these circumstances, the pyruvate generated by the actions of mitochondrial malic enzyme comes from fumarate precursors such as glutamine.
When glutamine is deaminated by glutaminase the resulting glutamate can be further deaminated by glutamate dehydrogenase yielding 2-oxoglutarate (α-ketoglutarate) which can then be shunted to malate synthesis in the TCA cycle. The malate can then be decarboxylated to pyruvate via mitochondrial malic enzyme. The pyruvate can then be decarboxylated by the PDHc and the resulting acetyl-CoA can enter the TCA cycle ultimately allowing for glutamine carbons to be oxidized for ATP synthesis.
Within β-cells of the pancreas, this process, driven by mitochondrial malic enzyme, serves as an important means for the use of amino acid carbon oxidation for the stimulated secretion of insulin. Indeed, this process is energetically equal to glucose-stimulated insulin secretion (GSIS).
Chronic increases in numerous other hormones, such as growth hormone, placental lactogen, estrogens, and progestins, up-regulate insulin secretion, probably by increasing the preproinsulin mRNA and enzymes involved in processing the increased preprohormone.
Role of Pyruvate Kinase in Regulation of Insulin Secretion
Within pancreatic β-cells, pyruvate kinase (PK) is localized to the plasma membrane closely associated with the KATP channel. Since the products of the PK reaction are ATP and pyruvate, the ATP can immediately interact with the KATP channel resulting in closure of the channel and membrane depolarization. When PK is highly active, the rate of mitochondrial ATP production via oxidative phosphorylation is reduced as a result of reduced ADP transport into the mitochondria. The deprivation of ADP from the mitochondria enhances synthesis rather than oxidation in this organelle. The synthesis reactions augment the level of phosphoenolpyruvate (PEP) which enhances the supply of PEP for the PK reaction. This latter process is referred to as the PEP cycle.
Pharmacologic activation of PK results in enhanced insulin secretion in the absence of an increase in glucose oxidation. These results implicate PK as a viable target for therapeutic intervention in type 2 diabetes.
Role of Intracellular pH in Insulin Secretion
Glucose uptake and metabolism by β-cells not only activates insulin secretion but also induces maturation of of immature secretory vesicles promoting further processing of proinsulin. This maturation process involves the acidification of the interior of the vesicles, a process that is essential to enhance the protease activity of PCSK1.
Members of the Smad family, specifically Smad5, which are signal transduction proteins coupled to activated TGF-β family receptors, play a role in the regulation of cytosolic pH in pancreatic β-cells. The significance of Smad5 to the regulation of insulin processing and secretion was demonstrated in mice in which the Smad5 gene was knocked out. In these knock-out mice glucose-stimulated insulin processing and secretion is significantly impaired. This impairment was, however, not due to loss of Smad5-mediated transcriptional regulation.
When glucose levels rise in β-cells, Smad5 accumulates in the cytosol. Within the cytosol of β-cells Smad5 interacts with the ATP6V1A encoded subunit of the V1 complex of the V-ATPase responsible for H+ transport into vesicles. This non-canonical role of Smad5 promotes the acidification of insulin secretory vesicles that ultimately promotes insulin processing and secretion.
The significance of intracellular pH regulation to the function of pancreatic β-cells cells is demonstrated by the fact that a high-fat diet is known to contribute to the development of type 2 diabetes. The effect of a high-fat diet on β-cells is an inhibition of the increased cytosolic pH that is necessary to trigger Smad5 interaction with V-ATPase and the subsequent acidification of insulin secretory vesicles. At the level of pancreatic β-cells, high-fat diets lead to reduced insulin secretion and subsequent reduce peripheral insulin-mediated responses, a hallmark of type 2 diabetes.
Role of Nitric Oxide in Insulin Secretion
Nitric oxide, NO plays a role in the regulation of insulin secretion from pancreatic β-cells. Within the pancreatic β-cells, NO is generated predominantly via the actions of neuronal nitric oxide synthase (nNOS; also known as NOS1). The function of NO in insulin secretion involves the regulation of the glucose-stimulated insulin secretion (GSIS) process described above. NO can act to mediate GSIS or to act as a negative feedback inhibitor of the process. The mechanisms by which NO elicit these effects on GSIS are the result of S-nitrosylation of proteins.
The metabolism of glucose in pancreatic β-cells is initiated via its phosphorylation by glucokinase. The activity of glucokinase in β-cells controlled by its subcellular localization. Whereas, in hepatocytes glucokinase is sequestered to the nucleus in the absence of glucose, in pancreatic β-cells the enzyme is sequestered to insulin-secretion granules in the absence of glucose. When glucose levels rise in the β-cells glucokinase undergoes S-nitrosylation of Cys371 which induces a conformational change in the enzyme inducing its release from the insulin-secretion granules. Glucokinase stably associates with nNOS allowing the S-nitrosylation reaction to proceed. Of clinical significance is the fact that two identified mutations in glucokinase, that are just proximal to the Cys371 residue, block S-nitrosylation of glucokinase and are the cause of a form of diabetes referred to as MODY-2.
GSIS involves the ATP-dependent closure of the plasma membrane-localized potassium channel (KATP), depolarization of the β-cells, and the opening of L-type calcium channels in the plasma membrane. The influx of calcium is involved in the fusion of the insulin-secretion granules with the plasma membrane and the release of insulin to the blood. Contributing to free intracellular calcium levels is the release of calcium stored in the endoplasmic reticulum (ER) via the activation of calcium-activated calcium release channels, specifically the type 2 ryanodine receptor (RYR2). Both the KATP channel and the RYR2 channel are modified by S-nitrosylation. With respect to the KATP channel it is the subunit encoded by the ABCC8 gene (commonly called the sulfonylurea receptor, SUR) that is S-nitrosylated on Cys717.
In addition to the regulation of insulin secretion, nitric oxide also contributes to the regulation of numerous effectors of downstream insulin signaling as described below.
Insulin Receptors
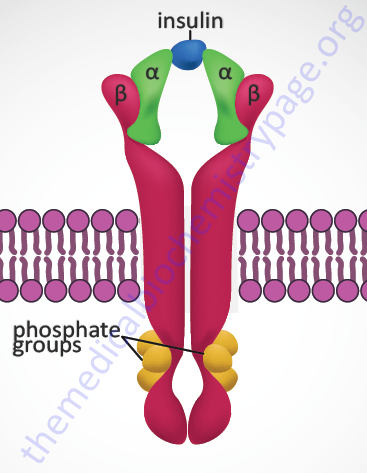
Insulin exerts all of its biological activities, both as a hormone and as a growth factor, by binding to a cell surface receptor complex. The insulin receptor is a member of the membrane-spanning receptor family that harbors intrinsic tyrosine kinase activity (see the Signal Transduction Pathways: Overview page). However, the insulin receptor is unique in that it is a heterotetrameric complex composed of two completely extracellular α-peptides that are disulfide bonded to the two transmembrane-spanning β-peptides. Both the α- and β- subunits of the receptor complex are derived from a single gene (symbol: INSR). This processing of the receptor is reminiscent of the processing of the preproinsulin protein leading to two peptides (A and B) disulfide bonded together to form bioactive insulin.
The INSR gene is located on chromosome 19p13.2 and is composed of 22 exons. Two alternative splicing variants of the insulin receptor preproprotein are generated from the INSR precursor mRNA. One form contains exon 11 sequences and is termed the IR-B form (Long preproprotein isoform) while the IR-A form (Short preproprotein isoform) does not. The result of the alternative splicing is that the α-subunit from the IR-B form has a 12-amino acid extension at its C-terminus. This form of the α-subunit is referred to as αCT. The IR-A isoform is most important in the processes of prenatal growth and development, whereas the IR-B isoform predominates in the metabolic processes regulated by insulin in the adult. In addition, the IR isoforms can form hybrid complexes with the type I insulin-like growth factor 1 receptor (IGF1R). The IR-A isoform, but not the IR-B isoform, can also bind the related growth factor, insulin-like growth factor 2 (IGF-2).
When insulin binds to the receptor it activates the intrinsic tyrosine kinase activity of the β-subunits resulting in autophosphorylation (transphosphorylation) of the receptor. These autophosphorylations occur on between 6 and 13 tyrosine residues with the most frequently observed being tyrosines at amino acid positions 1316, 1322, 1146, 1150, and 1151 in the intracellular portions of the β-subunits.
Insulin Signal Transduction
All of the post-receptor responses initiated by insulin binding to its receptor are mediated as a consequence of the activation of several divergent and/or intersecting signal transduction pathways. The Figure below is intended only to show several of the more significant signaling processes activated by the insulin receptor. These include association of insulin receptor substrates (of which there are three: IRS1, IRS2, and IRS4) with the receptor resulting in the activation of phosphatidylinositol-3-kinase (PI3K) and growth factor receptor binding protein 2 (GRB2). Activated PI3K phosphorylates membrane phospholipids, the major product being phosphatidylinositol-3,4,5-trisphosphate, (PIP3; also designated PtdIns-3,4,5-P3). PIP3 in turn activates the enzyme, PIP3-dependent kinase 1, (PDPK1). PDPK1 is also known as PDK1 but this can result in confusion since the PDK1 gene encodes a pyruvate dehydrogenase (PDH) kinase.
PDPK1 phosphorylates and activates another kinase called AKT. AKT (AK strain transforming) was originally identified as the tumor inducing gene in the AKT8 retrovirus found in the AKR strain of mice. AKT is also known as protein kinase B, PKB. Humans express three genes encoding proteins in the AKT family identified as AKT1 (PKBα), AKT2 (PKBβ), and AKT3 (PKBγ). It is AKT2 that is important in insulin-mediated glucose homeostasis, and is the form of AKT expressed in insulin-responsive tissues. Insulin-mediated activation of AKT2/PKBβ also results in inhibition of lipolysis and gluconeogenesis and activation of protein synthesis and glycogen synthesis.
More than 300 different substrates of the AKT enzymes have been identified. With respect to insulin-mediated signaling that affects metabolism, AKT2 phosphorylates glycogen synthase kinase-3β (GSK3β), ATP citrate lyase (ACYL), phosphodiesterase 3B (PDE3B), and the Rab-GTPase-activating protein encoded by the TBC1D4 (TBC1 domain family member 4) gene. The TBC1 domain refers domain found in a family of proteins that was originally identified in three proteins: Tre-2, BUB2, and CDC16. The phosphorylation of TBC1D4 ultimately contributes to the mobilization of GLUT4 vesicles to the plasma membrane.
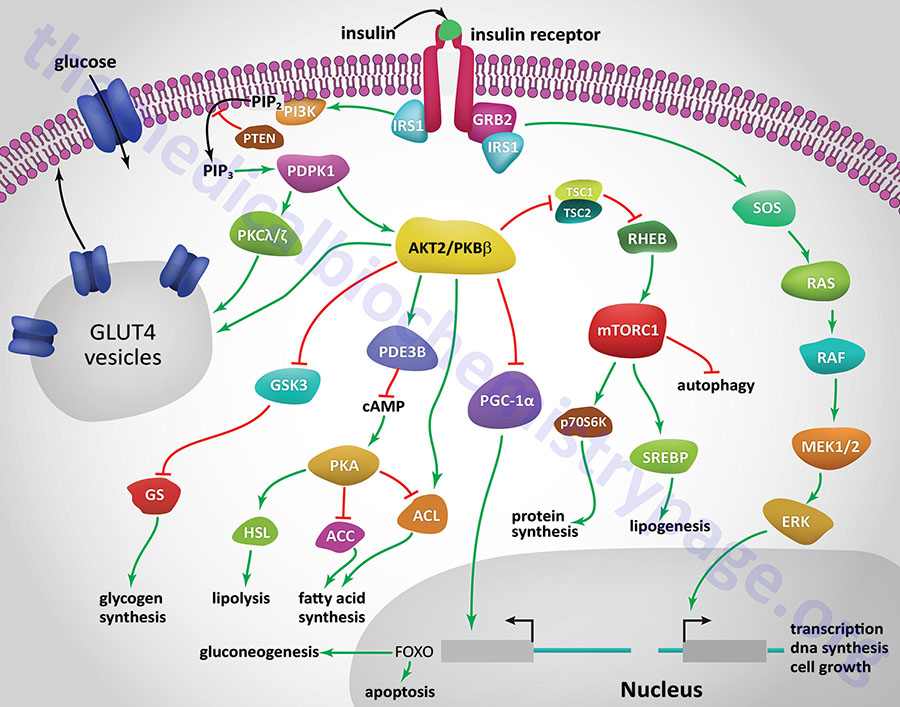
Insulin-mediated glucose uptake in adipose tissue and skeletal muscle involves activated PDPK1. In these tissues active PDPK1 phosphorylates some isoforms of protein kinase C, PKC. Within adipocytes and skeletal muscle the PKC isoform, PKCλ/ζ, phosphorylates proteins associated with intracellular vesicles containing the glucose transporter, GLUT4, resulting in their migration to, and fusion with, the plasma membrane. In addition to PDPK1, AKT2/PKBβ can also phosphorylate proteins associated with GLUT4 vesicles. These effects result in increased glucose uptake and metabolism in adipose tissue, which is required for triglyceride synthesis, and the uptake and storage of glucose as glycogen in skeletal muscle.
One of the major regulatory complexes activated as a result of insulin receptor activation of AKT2/PKBβ is the mechanistic target of rapamycin complex 1 (mTORC1). The mTORC1 is the major mTOR-containing complex that regulates cellular responses to growth factor signaling, nutrient deprivation, and various forms of cellular stress.
In addition to its effects on enzyme activity, insulin exerts effects on the transcription of numerous genes, effects that are primarily mediated by regulating the activity of the transcriptional co-activator, PGC-1α. In this context PGC-1α would normally activate genes involved in gluconeogenesis and the triggering of apoptosis. However, activation of AKT2/PKBβ results in inhibition of PCG-1α activity, thereby reducing hepatic glucose production via gluconeogenesis.
Insulin signaling also results in increased activation of the transcription factor, sterol-regulated element binding protein, SREBP. Increased SREBP activity in the liver results in increased glucose oxidation and increased fat synthesis. These transcriptional effects of SREBP include (but are not limited to) increased expression of glucokinase (encoded by GCK), liver pyruvate kinase (encoded by PKLR), lipoprotein lipase (encoded by LPL), fatty acid synthase (encoded by FASN), and acetyl-CoA carboxylase 1 (encoded by ACACA), and decreased expression of glucose 6-phosphatase (encoded by the G6PC gene), fructose 1,6-bisphosphatase (encoded by FBP1), and mitochondrial phosphoenolpyruvate carboxykinase (encoded by PCK2).
Another important metabolism regulating enzyme activated by insulin receptor signaling is small ribosomal subunit protein 6 (p70) kinase, (p70S6K). The p70S6K protein is encoded by the RPS6KB1 gene. The p70S6K enzyme, as well as PKC and PKG, belongs to the large AGC family of kinases which includes 10 genes encoding ribosomal protein S6 kinases.
Acting as a growth factor, insulin signaling activates the MAP kinase (MAPK) pathway either through insulin receptor phosphorylation of SRC homology 2 domain-containing protein 1 (encoded by the SHC1 gene) which then interacts with growth factor receptor binding protein-2 (GRB2) or via IRS1 activation. The activation of GRB2 results in signal transduction via the activation of the guanine nucleotide exchange factor, SOS (son of sevenless encoded by the SOS1 gene) which in turn activates the monomeric G-protein, RAS. Activation of RAS ultimately leads to changes in the expression of numerous genes via activation of members of the extracellular signal-regulated kinase (ERK) family of MAPK kinases.
Inceptor: Inhibitor of Insulin and Insulin Receptor Signaling
A transmembrane protein was recently (2021) identified in pancreatic β-cells that exhibits an activity to counteract the actions of the insulin receptor. These studies were carried out in mice and the identified protein was called inceptor. In humans, the ELAPOR1 (endosome-lysosome associated apoptosis and autophagy regulator 1) gene encodes the inceptor protein. In addition to the identified effects of the ELAPOR1 encoded protein on insulin and insulin receptor activity, the protein is also involved in autophagy, lysosomal degradation processes, secretory granule maturation, and acrosome formation.
Inceptor interacts with the insulin receptor and in so doing facilitates clathrin-mediated endocytosis of the insulin receptor. This action of inceptor results in insulin receptor desensitization. Lack of inceptor function is associated with hyperinsulinemia and hypoglycemia, in part due to an increase in pancreatic β-cell proliferation and mass.
In addition to insulin receptor desensitization, inceptor also affects the level of insulin (specifically proinsulin) in secretory vesicles in pancreatic β-cells. Within the trans-Golgi network (TGN) in pancreatic β-cells, inceptor binds to proinsulin and insulin directing their degradation in the lysosomes.
Insulin-Mediated Regulation of Metabolic Homeostasis
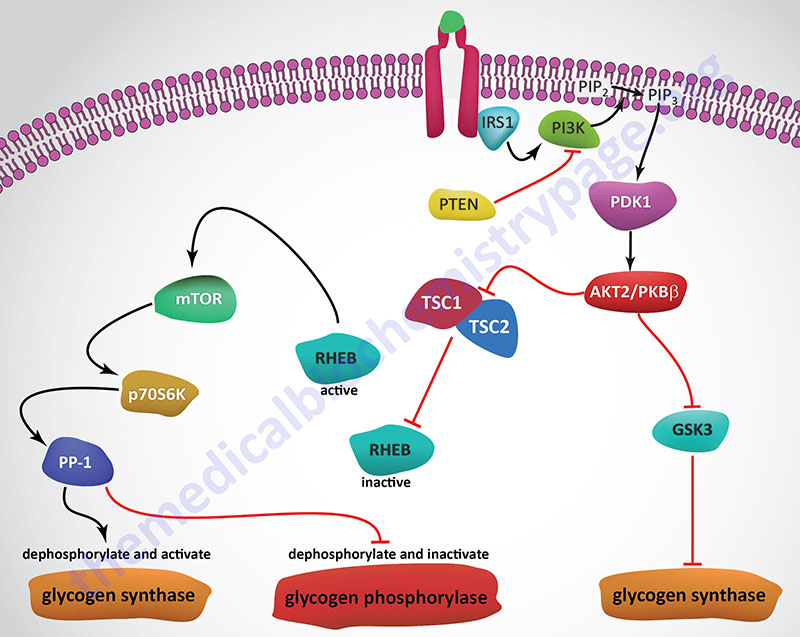
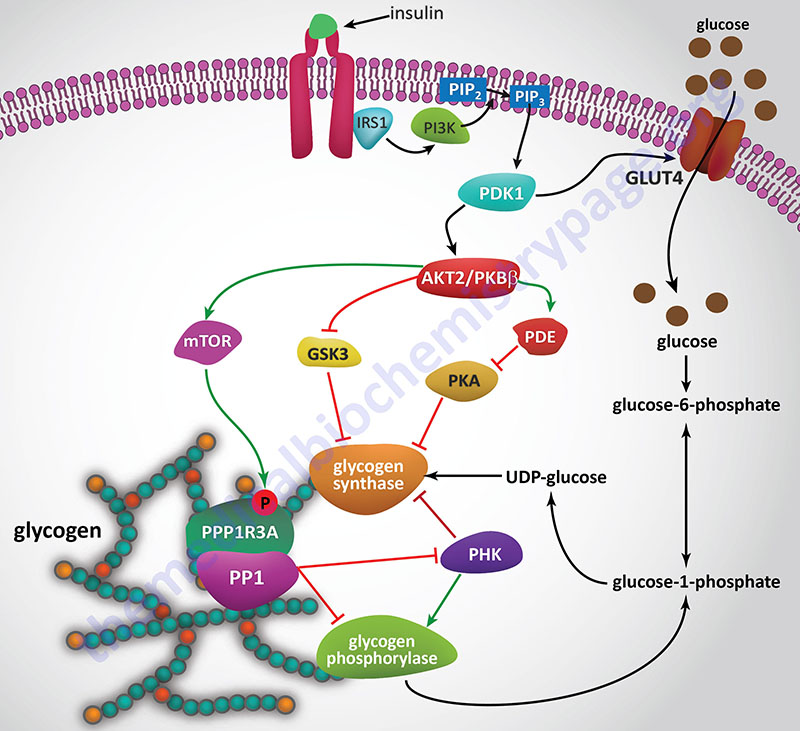
Insulin, secreted by the β-cells of the pancreas, is directly infused via the portal vein to the liver, where it exerts profound metabolic effects. With respect to hepatic glucose homeostasis, the effects of insulin receptor activation are specific phosphorylation and dephosphorylation events that lead to an increase in the storage of glucose with a concomitant decrease in hepatic gluconeogenesis and release of glucose to the circulation. Only those responses at the level of glycogen synthase and glycogen phosphorylase are represented in the Figure below.
In most non-hepatic tissues, particularly in adipose tissue and skeletal muscle, insulin increases glucose uptake by stimulating an increase in the number of plasma membrane glucose transporters: GLUT (specifically GLUT4). Glucose transporters are in a continuous state of turnover. Increases in the plasma membrane content of GLUT stem from an increase in the rate of recruitment of the transporters into the plasma membrane, deriving from a special pool of preformed transporters localized in the cytoplasm. GLUT1 is present in most tissues including pancreatic β-cells. GLUT2, in humans, is found primarily in intestine, kidney, and liver. GLUT3 is found primarily in neurons but also found in pancreatic β-cells, and the intestine. GLUT4 is found in insulin-responsive tissues such as heart, adipose tissue, and skeletal muscle. GLUT5 is expressed in intestine, kidney, testes, skeletal muscle, adipose tissue and brain.
In the liver, glucose uptake is dramatically increased because of increased activity of the enzymes glucokinase, phosphofructokinase-1 (PFK-1), and pyruvate kinase (PK), the key regulatory enzymes of glycolysis. The latter effects are induced by insulin-dependent activation of phosphodiesterase 3B (PDE3B) active. Insulin triggers activation of PDE3B via the insulin receptor signal transduction cascade that activates the kinase, AKT2 (PKBβ; often depicted as just AKT/PKB). Active AKT/PKB in turn phosphorylates and activates PDE3B. The resultant reduction in cAMP leads to decreased cAMP-dependent protein kinase (PKA) activity and diminished phosphorylation of pyruvate kinase and phosphofructokinase-2, PFK-2.
Dephosphorylation of pyruvate kinase increases its activity while dephosphorylation of PFK-2 renders it active as a kinase. The kinase activity of PFK-2 converts fructose-6-phosphate into fructose-2,6-bisphosphate (F2,6BP). F2,6BP is a potent allosteric activator of the rate limiting enzyme of glycolysis, PFK-1, and an inhibitor of the gluconeogenic enzyme, fructose-1,6-bisphosphatase. In addition, phosphatases (e.g. phosphoprotein phosphatase 1, PP-1) specific for the phosphorylated forms of the glycolytic enzymes increase in activity under the influence of insulin.
All these events lead to conversion of the glycolytic enzymes to their active forms and consequently a significant increase in glycolysis. In addition, glucose-6-phosphatase activity is down-regulated. The net effect is an increase in the content of hepatocyte glucose and its phosphorylated derivatives, with diminished blood glucose. In addition to the above described events, diminished cAMP and elevated phosphoprotein phosphatase 1 activity combine to convert glycogen phosphorylase to its inactive form and glycogen synthase to its active form, with the result that glucose is stored in the liver as glycogen. The effect of enhanced hepatic glycolysis is that glucose carbons are funneled through glycolysis and the pyruvate dehydrogenase complex (PDHc) with the resulting acetyl-CoA ultimately being used in fatty acid synthesis.
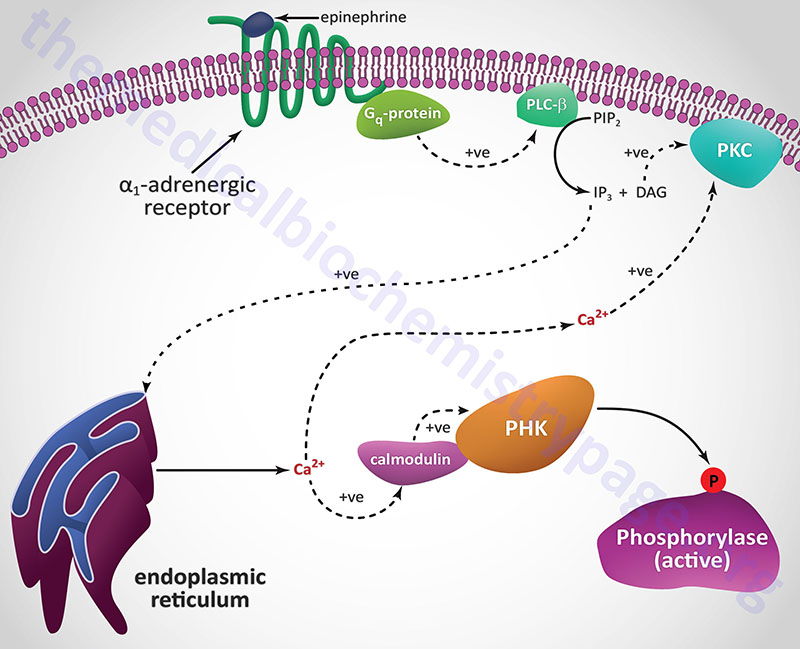
Epinephrine, the fight-or-flight hormone, diminishes pancreatic insulin secretion by a cAMP-coupled regulatory pathway. In addition, epinephrine counters the effect of insulin in liver and peripheral tissue, where it binds to β-adrenergic receptors, induces adenylate cycles activity, increases cAMP, and activates PKA similarly to that of glucagon action in the liver. The latter events induce glycogenolysis and gluconeogenesis, both of which are hyperglycemia-inducing and which thus, counter insulin’s effect on blood glucose levels. In addition, epinephrine influences glucose homeostasis through interaction with α1-adrenergic receptors in liver and skeletal muscle (see Figure below).
With respect to insulin responses and metabolism, activation of AKT2 (PKBβ) and PKC-λ lead to translocation of GLUT4 containing vesicles to the plasma membrane in adipocytes and skeletal muscle cells resulting in increased glucose uptake in these two tissues. Activation of AKT2 also leads to the phosphorylation and inhibition of glycogen synthase kinase-3β (GSK3β), which is a major regulatory kinase of glycogen homeostasis. In addition, AKT2 phosphorylates and inhibits the activity of a transcription factor (FOXO3; originally called FKHRL1) that has pro-apoptotic activity. This results in reduced apoptosis in response to insulin action.
Insulin Regulation of Hepatic Glucose Production
Regulation of glucose production by the liver, either by release from glycogen or via gluconeogenesis, is exerted by numerous factors with insulin playing the dominant role in the suppression of hepatic glucose production. Because of the anatomical arrangement of the liver and the pancreas, when insulin is released from the β-cells of the pancreas into the portal circulation nearly 50% is “captured” (also referred to as “extracted”) by hepatocytes. Although the predominant effect of insulin is through direct activation of hepatocyte insulin receptors, there are numerous systemic actions of the hormone that influence metabolic processes in the liver.
As outlined in the Figure above depicting pathways of insulin signal transduction, activation of the insulin receptor results in changes in both enzyme activity and changes in gene expression. The lipid kinase, PI3K, is activated by the insulin receptor and it phosphorylates membrane localized phosphatidylinositol-4,5-bisphophate (PIP2; also designated PtdIns-4,5-P2) generating phosphatidyinositol-3,4,5-trisphosphate (PIP3; also designated PtdIns-3,4,5-P3). PIP3 activates the kinase, PDPK1 (PIP3-dependent kinase 1) which then phosphorylates and activates the kinase, AKT2/PKBβ (often just written AKT/PKB or just AKT).
Substrates of AKT include enzymes that are involved in the regulation glucose and glycogen homeostasis as well as transcription factors that are responsible for the expression of several genes encoding glucose and glycogen metabolic enzymes. AKT phosphorylates glycogen synthase kinase 3β (GSK3β) which prevents it from phosphorylating and inhibiting glycogen synthase. This results in increased hepatic glycogen accumulation. AKT also phosphorylates, and thereby inhibits, the transcription factor, FOXO1, which is responsible for the activation of transcription of several genes encoding enzymes of gluconeogenesis. These genes include PCK1, which encodes the cytosolic form of phosphoenolpyruvate carboxykinase (PEPCK), and G6PC1, which encodes glucose-6-phosphatase. Reduced expression of these genes results in decreased hepatic gluconeogenesis.
Conversely, FOXO1 normally inhibits expression of the GCK gene that encodes glucokinase. The result of inhibited FOXO1 is, therefore, increased expression of glucokinase allowing increased trapping of glucose within hepatocytes so that the glucose can be stored in glycogen as well as oxidized via glycolysis.
One of the peripheral effects of insulin, that decreases hepatic glucose production, is the suppression of fatty acid release from adipose tissue. The hepatocyte oxidation of the fatty acids that are released by adipocytes is the major metabolic process generating the ATP required for glucose synthesis via gluconeogenesis. During periods of stress or fasting epinephrine and glucagon function in a concerted manner to maximally stimulate hepatic glycogen breakdown and gluconeogenesis. During the post-prandial state the release of insulin is designed to turn off these hepatocyte activities.
That peripheral effects of insulin contribute to suppression of endogenous glucose production by the liver has been demonstrated by comparing the rates of change as a result of portal vein delivery versus peripheral vein delivery of exogenous insulin. In these types of experiments in humans suppression of hepatic glucose production was greater with peripheral insulin delivery than with portal delivery.
There are multiple mechanisms that explain why insulin-mediated suppression of adipose tissue fatty acid release contribute to suppression of hepatic glucose production, specifically at the level of the regulation of both gluconeogenesis and glycolysis. As indicated above, hepatic oxidation of fatty acids is required to provide the ATP energy needed for gluconeogenesis. Oxidation of fatty acids also yields NADH that is needed by the glycolytic enzyme, glyceraldehyde-3-phosphate dehydrogenase, to function in the gluconeogenic direction. The increasing level of mitochondrial acetyl-CoA, as a result of hepatic fatty acid oxidation, results in increased transport of citrate to the cytosol which allosterically inhibits PFK-1. The acetyl-CoA also serves to turn on the primary gluconeogenic enzyme, pyruvate carboxylase. Finally, free fatty acids in the liver are known to activate the terminal enzyme of gluconeogenesis, glucose-6-phosphatase. Thus, the effects of insulin, at the level of adipose tissue, leads to suppression of endogenous glucose production by the liver.
Glucagon is a major activator of hepatic glycogen breakdown and activator of hepatic gluconeogenesis both of which contribute to endogenous glucose delivery to the blood from the liver. At the level of the pancreas insulin also functions to suppress hepatic glucose production. Although blood glucose is the primary regulator of glucagon release from α-cells of the pancreas, insulin is also a regulator of this process. Insulin exerts a direct inhibitory effect on pancreatic α-cells. Therefore, insulin-mediated suppression of glucagon secretion represents another peripheral effect of insulin in the suppression of hepatic glucose delivery to the blood. The effects of insulin on pancreatic glucagon release have been proposed to be both paracrine and endocrine effects that are related to the direction of islet blood flow from β-cells to α-cells.
Insulin also exerts suppressive effects on hepatic glucose production via the central nervous system, CNS. The evidence for the CNS effects of insulin relative to hepatic glucose production have been provided mostly with animal studies. When insulin is injected intracerebroventricularly there is a decline in endogenous glucose production that occurs 4-6 hours after injection. In addition, when CNS insulin signaling is inhibited by antibodies to insulin or by inhibitors of insulin receptor signaling molecules, systemic insulin fails to suppress hepatic endogenous glucose production. When insulin is directly infused into the mediobasal hypothalamus (MBH) the suppression of hepatic glucose production is associated with reduced expression of genes encoding hepatic gluconeogenic enzymes. This circuitry between the liver and the CNS relies on vagal efferent nerve transmission. Experiments have also shown that in addition to the hypothalamus, insulin exert suppression of endogenous glucose production via effects in the dorsal vagal complex (DVC).
Insulin Functions in Skeletal Muscle
The major, although not exclusive, metabolic effects of insulin in skeletal muscle are increased glucose import through mobilization of GLUT4 transporters to the plasma membrane, increased glucose storage as glycogen, and increased lipid synthesis and storage.
To effect increased glucose uptake into skeletal muscle cells insulin initially increases blood flow to the tissue. This is accomplished by insulin binding to its receptors on the vascular endothelial cells. Endothelial insulin receptors signal through IRS-2 which, via downstream effects, ultimately activates endothelial nitric oxide synthase (eNOS). Upon activation of eNOS the nitric oxide that is generate diffuses to the underlying smooth muscle cells resulting in relaxation resulting in vascular dilation and increased blood flow to the skeletal muscle. The increased perfusion contributes to the overall increased glucose uptake by the muscle in response to the actions of insulin.
Insulin-stimulated glucose uptake by skeletal muscle cells is accounted for by the increased amount of GLUT4 in plasma membrane, known as the sarcolemma in skeletal muscle cells (predominantly the T-tubule membrane fraction), and is not due to changes in the kinetic characteristics of the transporter. The increased level of GLUT4 in the plasma membrane is dynamically maintained in the presence of insulin. The dynamic characteristic represents the continued rapid recycling of internalized GLUT4 back to the plasma membrane, occurring as long as the insulin receptor is activated by binding insulin. Following a drop is plasma insulin levels the recycling of GLUT4 back to the plasma membrane returns to the pre-stimulation rate. Insulin-mediated GLUT4 movement to the plasma membrane and its continuous recycling with receptor stimulation represents a mode of transporter regulation that is distinct from the more typical regulation by gating of transporter activity.
Members of the monomeric G-protein Rab family, specifically Rab8a, Rab13, and TBC1 domain family member 4 (encoded by the TBC1D4 gene) have been shown to be critical to the insulin-stimulated mobilization of GLUT4 to the plasma membrane in skeletal muscle while Rab10 is involved in the process in adipocytes. The significance of the role of TBC1D4 in insulin function was demonstrated when a loss-of-function mutation was identified as the cause of severe isolated postprandial hyperinsulinemia.
The specific mechanism by which insulin gets from the blood to the surface of skeletal muscle cells is still not fully established. The most likely mechanism involves transcellular transport through the endothelial cells following the binding of insulin to receptors on the endothelial cells. This mechanism, in part, explains the lag in muscle glucose uptake following appearance of insulin in the blood. It is also possible for insulin to reach the skeletal muscle cells via paracellular transport but this mechanism is likely to be limiting due to the fact that the capillaries of muscle tissue possess a single layer of endothelial cells connected by tight junctions.
The plasma membrane of skeletal, as well as cardiac, muscle cells is unique in that it consists of the sarcolemma and the transverse tubules (T-tubules). Insulin receptors are present in both the sarcolemma and the membranes of the T-tubules. The T-tubules are specialized structures that allow the sarcolemma to be in contact with the membranes of the sarcoplasmic reticulum (SR). The SR is the muscle cell equivalent of the endoplasmic reticulum (ER) of other cell types. The interaction of the sarcolemma with the SR allows for rapid release of stored Ca2+ upon depolarization of muscle cells. The released Ca2+ is responsible for many of the metabolic responses of muscle cells in response to their activation by depolarization. The T-tubules are likely to represent the major site of glucose uptake in response to insulin stimulation since it has been shown that the majority of mobilized GLUT4 transporters are inserted into the T-tubule membrane.
With respect to insulin-mediated effects in skeletal muscle it is important to consider that human skeletal muscle fibers are grossly divided into two types; slow twitch (type I) and fast twitch (type II). Type II fibers are further divided into type IIa and type IIb fibers. Type IIa fibers are intermediate fast twitch fibers and can utilize both aerobic and anaerobic metabolism for ATP production. Type IIb fibers are the classic fast twitch fibers. Slow twitch muscle fibers primarily utilize fatty acid oxidation and contain a high concentration of mitochondria and store appreciable amounts of oxygen as oxymyoglobin. These two facts are the reason that slow twitch fibers are red in color. Fast twitch fibers primarily utilize glucose oxidation to pyruvate for ATP production, contain less mitochondria and myoglobin than slow twitch fibers, and thus, are white muscle fibers. Despite the preference of type I fibers for fatty acid oxidation, the skeletal muscle cells in these fibers possess the highest levels of the insulin receptor.
A unique feature of skeletal muscle, relative to glucose uptake, is that contraction or exercise induces a rapid insulin-independent increase in glucose uptake. The response of skeletal muscle to exercise also results in an increase in insulin-mediated glucose uptake compared to the rested state response. This exercise-mediated effect has been shown to last for up to 48 hours. In comparison, the lack of physical activity results in decreased skeletal muscle cell responses to insulin.
Following glucose uptake the primary fate is incorporation into glycogen even though, as in the case of exercise- or contraction-mediated effects, there is an increase in its oxidation. The increase in glycogen synthesis, in response to insulin, in skeletal muscle is, in part, the result of inhibition of one of the kinases known to phosphorylate and inhibit glycogen synthase, GS. The inhibited kinase is glycogen synthase kinase 3β (GSK3β). Insulin action also results in reduced phosphorylation of GS via activation of protein phosphatase 1 (PP1). For details on the regulation of GS go to the Glycogen Metabolism page.
Similar to its effects on GLUT4 translocation, insulin stimulates the translocation, to the plasma membrane, of several fatty acid transporters, including CD36/FAT, FATP1, FATP4, and FATPm. The mobilization of these fat transporters occurs via an insulin-stimulated mechanism that is similar to that leading to GLUT4 transporter mobilization.
Insulin action in skeletal muscle enhances lipid storage as triglycerides. Skeletal muscle access fatty acids either from free fatty acids bound to albumin or through the action of endothelial cell lipoprotein lipase (LPL) action on circulating lipoprotein particles. Within skeletal muscle capillaries insulin inhibits the activity of LPL. The promotion of skeletal muscle triglyceride synthesis in response to insulin presents a paradox given that in patients with type 2 diabetes and insulin resistance there is marked elevation in intramuscular triglyceride levels. This increased intramyocellular lipid is a significant contributor to insulin resistance in skeletal muscle.
The growth factor effects of insulin in skeletal muscle include increases in protein synthesis. The significance of this can be seen in both type 1 and type 2 diabetes patients. In the absence of adequate insulin type 1 diabetics can lose a significant amount of body mass. In uncontrolled type 2 diabetes patients there is an acceleration of muscle mass loss and strength, particularly in older patients. Contrast this to the situation where hyperinsulinemia is associated with an elevation in muscle protein synthesis. The molecular control of insulin-induced skeletal muscle protein synthesis is detailed in the Insulin as a Growth Factor: Regulation of Protein Synthesis section below.
Insulin Functions in Adipose Tissue
The major, although not exclusive, metabolic effects of insulin in adipose tissue are increased glucose import through mobilization of GLUT4 transporters to the plasma membrane, increased glucose metabolism, and increased lipid synthesis and storage.
Insulin-stimulated glucose uptake by adipocytes is accounted for by the increased amount of GLUT4 in plasma membrane just as is the case, explained above, in skeletal muscle. The role of insulin-mediated activation of Rab10 in GLUT4 containing vesicle mobilization was demonstrated by deletion of the gene. Deletion of Rab10 from adipocytes induces liver insulin resistance and glucose intolerance. However, Rab10 knockout only reduces insulin-stimulated glucose uptake by 50%. This demonstrates that whole-body glucose homeostasis is tightly linked to insulin-mediated control of glucose transport and metabolism in adipocytes.
The disposition of glucose taken up by adipocytes in response to insulin is distinct from that in skeletal muscle. In contrast to skeletal muscle and liver, less than 5% of the glucose taken up by adipocytes is stored as glycogen. The primary fate of the increased insulin-stimulated glucose uptake in adipocytes is its contribution to adipocyte triglyceride (TG) synthesis. Indeed, adipocytes are absolutely dependent upon glucose metabolism for the generation of triglycerides. This is due to the fact that adipocytes do no express the glycerol kinase gene and, therefore, require glycolysis to provide the glycerol-3-phosphate backbone of triglycerides. The glycerol-3-phopshate is generated through the action of glycerol-3-phosphate dehydrogenase acting on the glycolytic intermediate, glyceraldehyde-3-phosphate. In addition, the complete oxidation of glucose to acetyl-CoA, by the pyruvate dehydrogenase complex (PDHc), provides the acetyl-CoA necessary for de novo synthesis of free fatty acids. Indeed, nearly 50% of the carbon atoms in the glucose taken up by adipocytes is stored as TG.
Additional fates of glucose in adipocytes is metabolism to lactate which is then transported out of the cell. This lactate can be utilized as a source of fuel by other cells. In addition, the released lactate can bind to the hydroxycarboxylic acid 1, HCA1 (encoded by the HCAR1 gene) receptor triggering autocrine effects in the adipocyte or paracrine effects in other cells. HCA1 is coupled to a Gi-type G-protein which, upon activation, will lead to decreased levels of cAMP. HCAR1 is almost exclusively expressed in adipocytes and so lactate-induced activation of the receptor and the resultant decrease in cAMP leading to inhibition of lipolysis. In the context of increased glucose uptake and metabolism in response to insulin the lactate-induced stimulation of HCA1 will contribute to the insulin-induced inhibition of adipocyte lipolysis and activation of lipogenesis.
The conversion of glucose carbons to those of fatty acids within adipocytes exerts a major impact metabolic processes outside of adipose tissue. This is due to the fact that some of the lipids synthesized in adipocytes serve as signaling molecules that regulate metabolism and inflammation in other tissues. Endogenous lipid synthesis is, in part, regulated by the level of expression of genes encoding lipid metabolizing enzymes. This control of expression is exerted primarily by sterol regulatory element-binding protein (SREBP)1c, carbohydrate response element-binding protein (ChREBP), and liver X receptors (LXR). Within adipocytes it is ChREBP that is the dominant regulator of lipogenesis. When glucose levels rise, in adipocytes, protein phosphatase 2A delta (PP2Aδ) is activated by xylulose 5-phosphate which is an intermediate in the pentose phosphate pathway. PP2Aδ dephosphorylates Ser196 in ChREBP resulting in translocation of ChREBP into the nucleus. In the nucleus PP2Aδ dephosphorylates Thr666 which allows ChREBP to bind to specific sequence elements (ChoRE) in target genes. The critical role of ChREBP in adipocyte responses to insulin was demonstrated by selectively knocking down ChREBP levels in adipocytes in rodents. The reduction in ChREBP levels resulted in systemic insulin resistance with impaired insulin action in the liver, muscle, and adipose tissue. In humans, the level of ChREBP and lipogenic enzyme expression strongly correlates with insulin sensitivity. When insulin sensitivity is improved in patients with insulin-resistance the level of ChREBP expression increased.
Another important effect of ChREBP activation in adipocytes is increased synthesis of lipids that function as bioactive signaling molecules. One particularly important bioactive lipid family that is increased by ChREBP action in adipocytes is the branched fatty acid hydroxy fatty acids (FAHFA). The palmitic acid esters of hydroxy stearic acids (PAHSA) have been shown to exhibit anti-diabetic and anti-inflammatory effects. Although PAHSA are present in all tissues, their levels are highest in both white and brown adipose tissue, WAT and BAT. The level of PAHSA in the serum and in adipose tissue is reduced under conditions of insulin-resistant. PAHSA have been shown to improve glucose homeostasis in insulin-resistant obese mice as a result of enhanced insulin function in the liver leading to decreased hepatic glucose synthesis. PAHSA have also been shown to reduce the inflammatory state of adipose tissue.
The FAHFA family of lipids is not the only bioactive lipid mediators produced and released by adipocytes in response to the actions of insulin. These other bioactive lipids include diacylglycerols (DAG), acylcarnitines, ceramides, prostaglandins, lysophosphatidic acid (lysoPA; also designated LPA), palmitoleic acid, fatty acid amides, and numerous additional lipids of the large oxylipin family. The functions of these various bioactive lipids are broad and include augmenting or inhibiting insulin actions in other tissues, stimulating or inhibiting of fatty acid uptake, and mitochondrial oxidation processes. The role of ceramides in insulin resistance is discussed in detail below in the Mechanisms of Insulin Resistance Effected by Ceramides section.
In contrast to insulin-mediated lipogenesis in adipocytes, insulin action results in suppression of lipolysis in adipocytes. The suppression of adipocyte lipolysis represents a major action by which insulin regulates systemic metabolism. One of the mechanism by which insulin action in adipocytes leads to suppression of lipolysis is by the increased production of lactate from glucose metabolism. As indicated above, lactate stimulates the HCA1 receptor on adipocytes leading to decreased cAMP production. Decreased cAMP results in reduced activation of PKA, a major kinase regulating the activity of hormone-sensitive lipase, HSL. Reduced release of fatty acids and glycerol from adipose tissue directly links adipose tissue metabolism to that of the liver. Fatty acid oxidation in the liver provides the energy needed for hepatic gluconeogenesis and glycerol is a major carbon source for hepatic gluconeogenesis. Thus, insulin-mediated inhibition of adipose tissue lipolysis significantly contributes to reduced hepatic glucose output.
Role of Nitric Oxide in the Metabolic Effects of Insulin
As in the case of insulin secretion, nitric oxide (NO) plays an important role in regulating the mechanisms by which insulin exerts its numerous signaling processes. Beginning with the insulin receptor itself, numerous proteins that are involved in the responses to insulin have been demonstrated to be S-nitrosylated, some of which are outlined in the following Table.
Protein S-nitrosylation involves the attachment of the nitrosyl group to the reactive thiol group of a cysteine in a target protein generating an S-nitrosothiol (SNO) in the protein. S-nitrosylation of proteins involves enzymes called SNO synthases and tansnitrosylases. SNO synthases and transnitrosylases can both be classified as protein S-nitrosylases.
Recent evidence has identified a novel SNO synthase, that utilizes S-nitroso-CoA (SNO-CoA) as its cofactor, in the regulation of insulin receptor signaling. This enzyme has been identified as SCAN (SNO-CoA-assisted nitrosylase). SCAN has been shown to nitrosylate numerous proteins including the insulin receptor and insulin receptor substrate 1, IRS1. The consequences of SCAN activity are decreased insulin receptor-mediated signaling. Of clinical significance is that the level of SCAN activity increases with increasing fat mass resulting in insulin resistance as a consequence of hypernitrosylation of the insulin receptor and IRS1.
Table of S-Nitrosylated Proteins in Insulin-Mediated Processes
| Protein | Functions /Comments |
| AKT/PKB | as described above, humans express three genes encoding proteins of the AKT/PKB kinase family; AKT/PKB kinases are important in insulin-mediated glucose homeostasis; insulin-mediated activation of AKT/PKB also results in inhibition of lipolysis and gluconeogenesis and activation of protein synthesis and glycogen synthesis; major substrates for AKT/PKB in insulin signaling includes GSK3β, PDE3B, and TSC1/2; S-nitrosylation of AKT1/PKBα on Cys224 inhibits its normal function and is associated with insulin resistance |
| CTSB | CTSB encodes cathepsin B which is a lysosomal cysteine protease involved in the process of autophagy; S-nitrosylation of cathepsin B inhibits its normal function and is associated with insulin resistance |
| GSK3β | glycogen synthase kinase 3β is one of several kinases that phosphorylate glycogen synthase; S-nitrosylation of GSK3β inhibits its kinase activity and is associated with insulin resistance |
| HEXB | HEXB encodes the β-subunit of β-hexosaminidase; is involved in the process of autophagy; S-nitrosylation of HexB protein inhibits its normal function and is associated with insulin resistance |
| INSRβ | is the β-subunit of the heterotetrameric insulin receptor; harbors the intrinsic tyrosine kinase activity of the receptor; S-nitrosylation of the β-subunit inhibits its normal function and is associated with insulin resistance |
| IRE1α | inositol requiring enzyme 1α (IRE1α); is involved in the unfolded protein response (UPR); S-nitrosylation of the IRE1α inhibits its normal function and is associated with insulin resistance |
| IRS1 | insulin receptor substrate 1; interacts with tyrosine phosphorylated β-chain of the insulin receptor; is tyrosine phosphorylated by the insulin receptor and acts a s a docking site for other signaling proteins such as PI3K; S-nitrosylation of IRS1 protein inhibits its normal function and is associated with insulin resistance |
| PDE3B | phosphodiesterase 3B is major insulin-induced phosphodiesterase that degrades cAMP to AMP thereby turning off PKA-mediated phosphorylation; S-nitrosylation of PDE3B protein inhibits its normal function and is associated with insulin resistance |
| PTEN | phosphatase and tensin homolog deleted on chromosome 10; is a phosphatidylinositol-3-phosphate phosphatase; dephosphorylates phosphatidylinositol-3-phosphate (PtdIns-3-P), PtdIns-3,4-P2, and PtdIns- 3,4,5-P3; S-nitrosylation of PTEN protein enhances insulin signal transduction |
| SHIP2 | SH2 (Src homology 2)-domain containing inositol phosphatase 2; is encoded by the INPPL1 (inositol polyphosphate phosphatase like-1) gene; negatively regulates insulin signaling and glucose homeostasis; polymorphisms are associated with a predisposition to insulin resistance; S-nitrosylation of SHIP2 protein enhances insulin signal transduction |
| SIRT1 | is a member if the sirtuin family of NAD-dependent deacetylases; S-nitrosylation of SIRT1 blocks its deacetylase activity which results in the augmentation of the acetylation of NF-κB leading to enhanced NF-κB transcriptional activity and induction of a pro-inflammatory state; S-nitrosylation of SIRT1 is associated with insulin resistance |
| TSC1/2 | TSC1 and TSC2 are tuberous sclerosis tumor suppressor 1 (hamartin) and 2 (tuberin); function to inhibit the activity of RHEB (RAS homolog expressed in brain) which is an activator of mTOR as described in the next section; although S-nitrosylation of TSC1/2 is known to occur the precise effect on insulin signaling is yet to be fully characterized |
Insulin as a Growth Factor: Regulation of Protein Synthesis
The role of insulin in the stimulation of protein synthesis occurs at the level of translational initiation and elongation and is exerted primarily via a cascade leading to the activation of mechanistic target of rapamycin complex 1 (mTORC1). The protein mTOR, of the mTORC1 complex, is a protein with homology to a family of proteins first identified in yeast that bind to the immunosuppressant drug, rapamycin. Rapamycin gets its name from the fact that the compound was isolated from the bacterium Streptomyces hygroscopicus discovered on Easter Island (Rapa Nui). mTOR is a kinase whose catalytic domain shares significant homology with lipid kinases of the phosphatidylinositol-3-kinase (PI3K) family.
mTOR is actually a component of two distinct multiprotein complexes termed mTORC1 and mTORC2 (mTOR complex 1 and mTOR complex 2). The activity of mTORC1 is sensitive to inhibition by rapamycin whereas mTORC2 is not. Within the context of mTOR activity, mTORC1 is the central complex as it is responsible for integrating a diverse series of signal transduction cascades initiated by changes in both intra- and extracellular events. Activation and/or regulation of mTORC1 is involved in the control of cell proliferation, survival, metabolism, and stress responses. These events can be triggered by nutrient availability, glucose, oxygen, and numerous different types of cell surface receptor activations, each of which eventually impinge on the activity of mTORC1. The mTORC1 is, in fact, the major mTOR-containing complex that regulates cellular responses to nutrient deprivation and various forms of cellular stress.
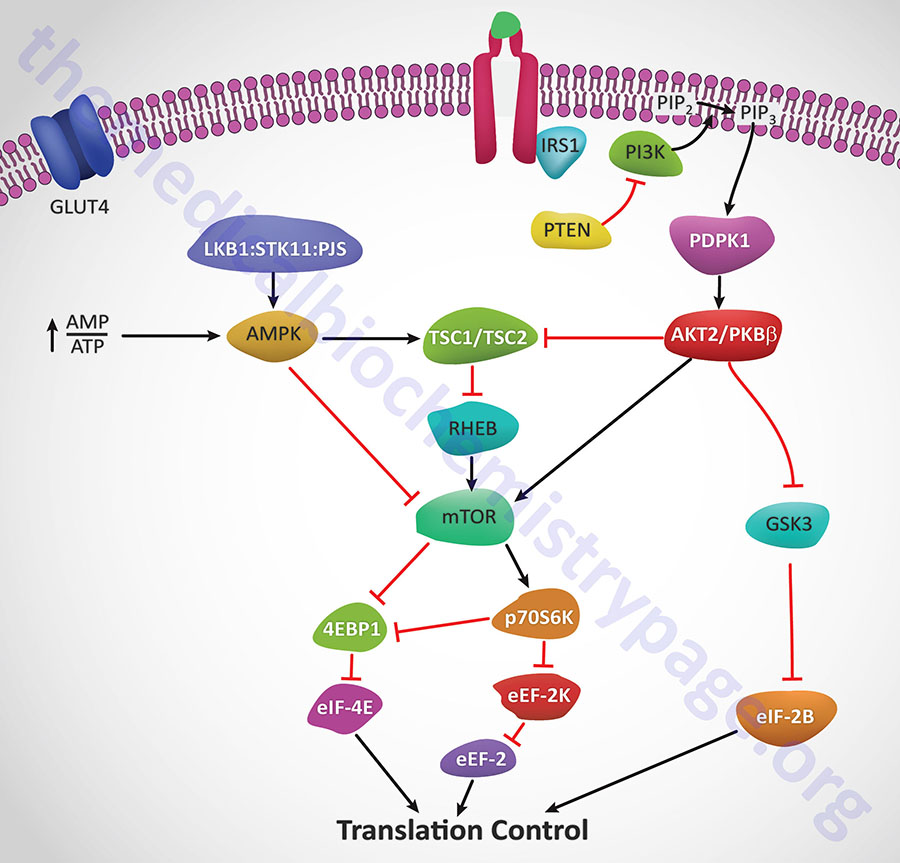
Insulin action leads to an increase in the activity of PI3K which in turn phosphorylates membrane phospholipids generating phosphatidylinositol-3,4,5-trisphophate (PIP3) from phosphatidylinositol-4,5-bisphosphate (PIP2). PIP3 then activates the kinase PDPK1 which in turn phosphorylates and activates AKT1 (PKBα). Activated AKT1 will phosphorylate TSC2 (tuberin) of the TSC1/TSC2 complex on two residues (S939 and T1462) resulting in altered activity of the complex. The TSC1/TSC2 complex functions as a GTPase-activating protein (GAP) which increases GTP hydrolyzing activity of Rheb. The GAP activity resides in the C-terminal portion of tuberin. The faster the GTPase action of Rheb the faster will be the reduction in Rheb activation of mTOR. When TSC1/TSC2 is phosphorylated by AKT1 it is less effective at stimulating the GTPase activity of Rheb and therefore Rheb activation of mTOR will remain high as is the case in response to insulin action.
AMPK phosphorylates TSC2 at two sites (T1271 and S1387) that are distinct from the sites that are the AKT1 targets for phosphorylation. Evidence indicates that the AMPK-mediated phosphorylation of TSC2 promotes the GTPase activity of Rheb resulting in inhibition of mTOR and thus a decrease in protein synthesis. Recent evidence has shown that AKT1 actually phosphorylates tuberin at 4 sites (S939, S1130, S1132, T1462) all of which result in inhibition of the Rheb-GAP activity of the TSC1/TSC2 complex.
The ultimate activation of mTOR leads to phosphorylation and activation of p70S6K which in turn leads to increased phosphorylation of eEF2 kinase. eEF2 kinase normally phosphorylates eEF2 leading to a decrease in its role in translation elongation. When phosphorylated by p70S6K, eEF2 kinase is less active at phosphorylating eEF2, thus eEF2 is much more active in response to insulin action. In addition, insulin action leads to a rapid dephosphorylation of eEF-2 via activation of protein phosphatase 2A (PP2A). Taken together, reduced eEF2K-mediated phosphorylation and increased eEF-2 dephosphorylation lead to increased protein synthesis.
Both mTOR and p70S6K have been shown to phosphorylate the regulator of translation initiation, eIF-4E binding protein, 4EBP1. Phosphorylation of 4EBP1 prevents it from binding to eIF-4E. Binding of 4EBP1 to eIF-4E prevents eIF-4E from interaction with the cap structure of mRNAs which is necessary for translational initiation. Thus, the consequences of 4EBP1:eIF-4E interaction is a reduction in translation initiation. As a consequence of the concerted actions of mTOR and p70S6K, insulin results in increased protein synthesis.
AKT2/PKBβ activation will also lead to phosphorylation and inhibition of glycogen synthase kinase-3β (GSK3β). One of the targets of GSK3β, relative to translation, is eIF2B. Phosphorylation of eIF2B prevents it from performing its GTPase activating (GAP) function in association with eIF2 (go to the Protein Synthesis (Translation): Processes and Regulation page for more details) and as a consequence results in reduced translational initiation. However, when GSK3β is inhibited by AKT phosphorylation the GAP activity of eIF2B remains high and consequently the rate of translational initiation by eIF2 remains high so protein synthesis is favored.
Insulin also has profound effects on the transcription of numerous genes, effects that are primarily mediated by regulated function of sterol-regulated element binding protein, SREBP. These transcriptional effects include (but are not limited to) increases in glucokinase, pyruvate kinase, lipoprotein lipase (LPL), fatty acid synthase (FAS) and acetyl-CoA carboxylase (ACC) and decreases in glucose 6-phosphatase, fructose 1,6-bisphosphatase and phosphoenolpyruvate carboxykinase (PEPCK).
Control of Insulin Secretion by Nutrients and Hormones
Two of the many gastrointestinal hormones have significant effects on insulin secretion and glucose regulation. These hormones are the glucagon-like peptides (principally glucagon-like peptide-1, GLP-1) and glucose-dependent insulinotropic peptide (GIP). Both of these gut hormones constitute the class of molecules referred to as the incretins. Incretins are molecules associated with food intake-stimulation of insulin secretion from the pancreas.
Details of the actions of GLP-1 and GIP can be found in the Gut-Brain Interrelationships and the Control of Feeding page. Briefly, GLP-1 is derived from the product of the proglucagon gene (gene symbol: GCG). This gene encodes a preproprotein that is differentially cleaved dependent upon the tissue in which it is synthesized. For example, in pancreatic α-cells proprotein convertase subtilisin/kexin type 2 (PCSK2; also referred to as prohormone convertase 2) action leads to the release of glucagon. In the gut, proprotein convertase subtilisin/kexin type 1 (PCSK1) action leads to release of several peptides including GLP-1. Upon nutrient ingestion GLP-1 is secreted from intestinal enteroendocrine L-cells that are found predominantly in the ileum and colon with some production from these cell types in the duodenum and jejunum. Bioactive GLP-1 consists of 2 forms; GLP-1(7-37) and GLP-1(7-36)amide, where the latter form constitutes the majority (80%) of the circulating hormone.
The primary physiological responses to GLP-1 are glucose-dependent insulin secretion, inhibition of glucagon secretion, and inhibition of gastric acid secretion and gastric emptying. The latter two effects will lead to increased satiety with reduced food intake along with a reduced desire to ingest food. The action of GLP-1 at the level of insulin and glucagon secretion results in significant reduction in circulating levels of glucose following nutrient intake. This activity has obvious significance in the context of diabetes, in particular the hyperglycemia associated with poorly controlled type 2 diabetes. The glucose lowering activity of GLP-1 is highly transient as the half-life of this hormone in the circulation is less than 2 minutes. Removal of bioactive GLP-1 is a consequence of N-terminal proteolysis catalyzed by dipeptidylpeptidase IV (DPP IV or DPP4). For more complete information on the activities of DPP4 go to the Dipeptidyl Peptidase: DPP4 page.
Wnt Signaling, GLP-1, and Insulin Secretion
Although much of the research that has led to a detailed understanding of the signal transduction pathways initiated by the proteins of the Wnt family was carried out in models of early development, evidence has been accumulating demonstrating a significant role for the Wnt in the control of metabolism. In particular Wnt action has been shown to be involved in metabolic control via its actions in both the gut and pancreas. In addition, Wnt signaling has been shown to interact with signaling pathways induced by insulin.
In the gut Wnt has been shown to be involved in regulated expression of the GCG gene. In intestinal enteroendocrine L cells the expression of the GCG gene results in the production of GLP-1. As indicated above, GLP-1 exerts its effects on the gut, the pancreas and in the brain. In the gut its effects lead to a reduced rate of gastric acid secretion and reduced gastric emptying. In the pancreas GLP-1 induced β-cell proliferation and inhibition of β-cell apoptosis. In the brain GLP-1 actins result in increased satiety leading to reduced desire for food intake.
The GCG gene promoter region contains an enhancer that harbors a canonical Wnt response element that binds TCF factors, in particular the TCF7L2 protein. Genome wide screens for polymorphisms associated with type 2 diabetes demonstrated that two single nucleotide polymorphisms (SNP) in the TCF7L2 gene were the most frequently occurring SNPs associated with this disease. The significance of Wnt in the control of GLP-1 production was demonstrated by the fact that reduction/loss of either β-catenin or TCF7L2 function completely blocks insulin-stimulated expression of the intestinal GCG gene. In addition, the effects of GLP-1 on the pancreas (i.e. proliferation and anti-apoptosis) are effected via the actions of β-catenin and TCF7L2. In the pancreas insulin inhibits expression from the GCG gene leading to reduced production of glucagon. This action has physiological significance because glucagon is the major counter-regulatory hormone to insulin action. The important role of TCF7L2 in pancreatic function can be demonstrated in experiments that lead to reduction in the levels of TCF7L2. In these types of experiments there is an increased rate of pancreatic β-cell apoptosis, reduced β-cell proliferation, and reduced glucose-dependent insulin secretion.
The demonstration of cross-talk between the Wnt and insulin signaling pathways is important as these observations may eventually lead to novel approaches to the treatment of type 2 diabetes.
Resistance to the Actions of Insulin
Insulin resistance (IR) refers to the situation whereby insulin interaction with its receptor fails to elicit downstream signaling events such as those depicted in the Figures above. Metabolically and clinically the most detrimental effects of IR are due to disruption in insulin-mediated control of glucose and lipid homeostasis in the primary insulin-responsive tissues: liver, skeletal muscle, and adipose tissue.
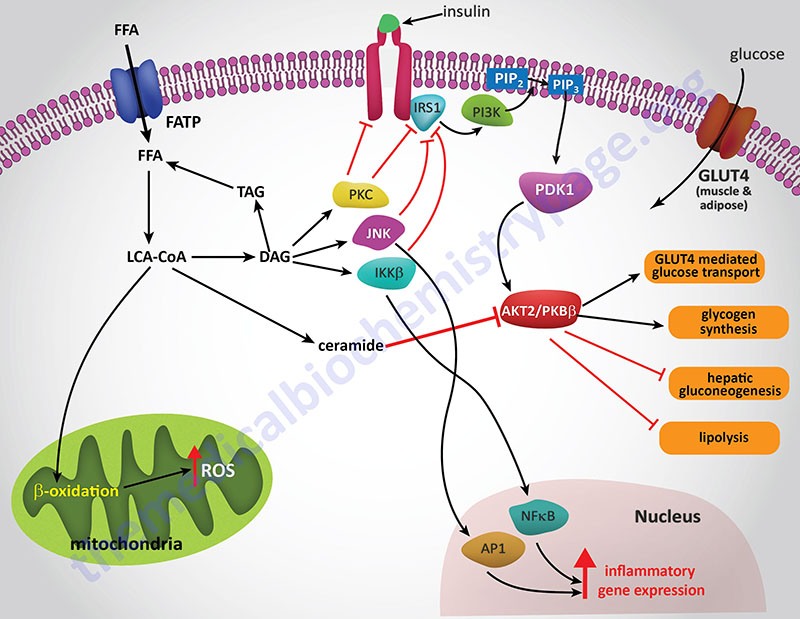
IR is a characteristic feature found associated with most cases of type 2 diabetes. In addition, IR is the hallmark feature of the metabolic syndrome (MetS). IR can occur for a number of reasons however, the most prevalent cause is the hyperlipidemic and pro-inflammatory states associated with obesity. How does an abnormal metabolism, as is associated with obesity, lead to the development of IR? The answer to this question can be found in the effects of excess free fatty acids (FFA) on the insulin receptor-mediated signaling pathways in adipose tissue, liver, and skeletal muscle as well as the pro-inflammatory status induced by the toxic effects of excess FFA, principally in the liver and adipose tissues.
The precise mechanisms that underlie the promotion of a pro-inflammatory state in obese individuals in not completely established. However, both adipose tissue and liver are important mediators of systemic inflammation in obesity through increased release of adipokines and hepatokines, respectively.
One model proposes that the expansion of adipose tissue that occurs in obesity results in large adipocytes that have metabolic capacities that exceed the local oxygen supply. The resultant hypoxia leads to the activation of cellular stress response pathways induced by the hypoxia induced factor 1 (HIF-1) transcription factor. Activation of HIF-1 is associated with cell autonomous inflammation and the release of pro-inflammatory cytokines. As a part of the chronic inflammation, adipocytes secrete chemokines such as IL-8 and macrophage chemotactic protein-1 (MCP-1) that attract pro-inflammatory macrophages into the adipose tissue. These activated adipose tissue macrophages secrete cytokines that further exacerbate the pro-inflammatory state.
In the liver, inflammatory processes are also activated due to the excess accumulation of fatty acids and triglycerides which is the consequence of activated stress response pathways. Within the liver, Kupffer cells (resident liver macrophages) become activated by the generation of reactive oxygen species (ROS) and induction of stress responses. These activated Kupffer cells release locally acting cytokines that, like in adipose tissue, exacerbates the pro-inflammatory environment.
Within the vasculature, saturated FFAs can directly activate pro-inflammatory pathways in endothelial cells and myeloid-derived cells resulting in the induction and propagation of a systemic pro-inflammatory state.
Hepatic IR is induced by the excess accumulation of FFAs. Within the hepatocyte, metabolites of the FFA re-esterification process, including long-chain acyl-CoAs and diacylglycerol (DAG), accumulate. Excess FFAs also participate in the relocation of several protein kinase C (PKC) isoforms, from the cytosol to the membrane compartment. These PKC isoforms include PKC-β2, PKC-δ, PKC-epsilon (PKC-ε), and PKC-theta (PKC-θ).
DAG is a potent activator of these PKC isoforms and the membrane-associated PKCs will phosphorylate the intracellular portion of the insulin receptor on serine residues which results in impairment of insulin receptor interaction with downstream signaling proteins including insulin receptor substrate 1 (IRS1) and IRS2. Loss of IRS1 and IRS2 interaction with the receptor prevents interaction with phosphatidylinositol 3-kinase (PI3K) and its subsequent activation. In addition to serine phosphorylation of the insulin receptor, various PKC isoforms have been shown to phosphorylate IRS1 and IRS2 further impairing the ability of these insulin receptor substrates to associate with the insulin receptor and downstream effector proteins such as PI3K.
The FFA-induced down-regulation of insulin signaling pathways results in activation of several kinases involved in stress responses. These kinases include Jun N-terminal kinase (JNK), inhibitor of nuclear factor kappa B kinase beta (IKKβ), and suppressor of cytokine signaling-3 (SOCS-3). Like PKC, JNK activity is also regulated by FFA and is an important regulator of IR. The target of JNK action is Ser307 of IRS-1 and this phosphorylation plays an important role in the progression to hepatic IR. Activation of IKKβ (which is required for the activation of nuclear factor kappa B, NFκB) may have the most pronounced effect on inflammatory responses in the liver and adipose tissue. NFκB is the most important transcription factor activating the expression of numerous pro-inflammatory cytokine genes such as interleukin-1 (IL-1), IL-6, and tumor necrosis factor-alpha (TNFα) each of which have been shown to be involved in promoting IR. NFκB-dependent inflammatory mediators produced in hepatocytes act to reduce insulin sensitivity and to promote liver injury.
Analysis of the effects of FFAs on macrophages in cell culture demonstrated that they can activate inflammatory signaling through the toll-like receptors (TLR), specifically TLR4. The TLR are a family of cell surface receptors involved in key events triggered via the innate immune system. The TLR are pattern recognition receptors that recognize structurally conserved molecules from microbial pathogens. TLR4 is responsive to bacterially derived lipopolysaccharide (LPS) which is an endotoxin secreted by gram-negative bacteria. LPS stimulation of TLR4 results in activation of both the JNK and IKKβ signal transduction pathways leading to secretion of pro-inflammatory cytokines such as IL-1β, IL-6, MCP-1, and TNFα. These cell culture experiments demonstrated that FFA addition to macrophages results in activation of NFκB and that this activation was deficient in macrophages from TLR4 knock-out mice. In the livers of TLR4 knock-out mice there is reduced inflammation even in the presence of hepatic steatosis suggesting that Kupffer cell TLR4 is important in hepatic inflammatory responses to excess FFA loading.
Mechanisms of Insulin Resistance Effected by Ceramides
Numerous lines of evidence have shown that various inducers of cellular stress such as inflammatory activation, excess saturated fatty acid intake, and chemotherapeutics, result in increased rates of ceramide synthesis. In addition, there is ample evidence demonstrating that the accumulation of cellular ceramides is associated with the pathogenesis of diseases such as obesity, diabetes, atherosclerosis, and cardiomyopathy.
For example, studies in mice have correlated endogenous ceramides and glucosylceramides with the antagonism of insulin-stimulated glucose uptake and synthesis. In animal models of obesity, evidence shows that genetic or pharmacological inhibition of ceramide or glucosylceramide biosynthesis leads to increased peripheral insulin sensitivity while at the same time reducing the severity of pathologies associated with insulin resistance including diabetes, atherosclerosis, hepatic steatosis, and/or cardiomyopathy. With respect to overall lipid homeostasis and the role of adipose tissue in disease pathology, studies have revealed roles for the adipokines, leptin, adiponectin, and tumor necrosis factor alpha (TNFα), in the modulation of cellular ceramide levels.
An enhanced systemic inflammatory status as well as cellular stress have both been associated with insulin resistance. With respect to biological lipids, excess lipid intake, especially saturated fatty acids, leads to mitochondrial and endoplasmic reticulum (ER) stress. Increased fat oxidation in mitochondria leads to the production of reactive oxygen species (ROS) which are known to result in insulin resistance. Both mitochondrial and ER stress can result in apoptosis. Excess fatty acid intake also interferes with normal insulin receptor-mediated signal transduction resulting in insulin resistance. Excess saturated fatty acid intake, particularly palmitic acid, results in increased ceramide synthesis which has been shown to be both a cause and effector of pancreatic β-cell stress resulting in impaired insulin secretion. Obesity, which results in insulin resistance and development of type 2 diabetes, has long been associated with low-grade systemic inflammation. The correlation between obesity, ceramide synthesis, and insulin resistance is discussed below.
The ability of ceramides to interfere with insulin receptor signaling is the result of blocking the receptors ability to activate the downstream effector kinase, AKT/PKB. Experiments in cell culture, involving both adipocytes and skeletal muscle cells, have shown that ceramides inhibit insulin-stimulated glucose uptake by blocking translocation of GLUT4 to the plasma membrane as well as interfering with glycogen synthesis. That blockade of AKT/PKB activation is central to the effects of ceramides can be demonstrated by constitutive overexpression of the kinase which negates the effects of ceramides. Thus, far the action of ceramides at blocking activation of AKT/PKB has been shown in all cell types tested.
Several lines of evidence have solidified the model of ceramides leading to insulin resistance as a consequence of blockade of AKT/PKB activation. Administration of ceramide to cells in culture blocks the translocation of AKT/PKB to the plasma membrane. This inhibition of translocation is the result of the phosphorylation of a regulatory site in the PH domain. The phosphorylation leads to reduced affinity of the kinase for phosphoinositides.
The kinase responsible for the ceramide-induced phosphorylation of AKT/PKB is likely to be the atypical PKC isoform PKCζ since this kinase is activated by ceramides in vitro. Additional evidence pointing to a link between ceramides and activation of PKCζ is that mutation of a target serine in the kinase, S34, to alanine confers resistance to ceramide action. Also, ceramide addition has been shown to stabilize interactions between AKT/PKB and PKCζ via their recruitment membrane rafts or caveolae.
Another mechanism by which ceramides impact the activity of AKT/PKB is by activating protein phosphatase 2A (PP2A) to dephosphorylate the kinase. Experiments that were designed to specifically inhibit PP2A were shown to prevent the effects of ceramide on AKT/PKB in a number of different cell types. In some cell types, both mechanisms are functional, while in other cell culture systems either PKCζ or PP2A is the central mediator of ceramide effects.
Palmitic acid (C16:0) is the most abundant saturated fatty aid in the circulation. The role of saturated fatty acids in increased levels of ceramides has been demonstrated by adding palmitate to cultured muscle cells. In this system the addition of palmitate results in increased ceramide accumulation while simultaneously inhibiting AKT/PKB. Ceramide synthesis was indeed required for the effect of palmitate addition on the activity of AKT/PKB since pharmacological inhibition of ceramide synthesis or siRNA-mediated knockdown of several enzymes required for ceramide biosynthesis (serine palmitoyltransferase, ceramide synthases, or dihydroceramide desaturase) completely blocks the effects of palmitate on insulin signaling.
An alternative means to examine the effects of ceramides on insulin sensitivity is to block the pathways of ceramide metabolism. Treatment of cells with acid ceramidase inhibitors results in increased endogenous ceramide levels while simultaneously blocking insulin-mediated activation of AKT/PKB. Under conditions of ceramidase inhibition there is an exaggerated effect of palmitic acid addition on insulin resistance. Conversely, if one overexpresses acid ceramidase, the inhibition of insulin signaling induced by palmitate addition is completely blocked.
The cellular effects of glucosylceramide, although similar to ceramides themselves, does exhibit cell-type specificity. Glucosylceramide is the precursor for a complex family of gangliosides, for example the GM3 ganglioside. Adipocytes are highly sensitive to the insulin inhibitory effects of glucosylated sphingolipids, whereas muscle cells are unaffected. Addition of GM3 ganglioside to adipocytes inhibits insulin activation of the IRS-1.
In addition, TNFα treatment induces GM3 accumulation in membrane lipid rafts allowing for association with the insulin receptor through caveolin-1 present in the rafts. The the antagonistic effects of the TNFα can be prevented by depleting cells of glucosylated ceramides.
Obesity is associated with adipose tissue enrichment in the complex gangliosides, GM2, GM1, and GD1a. The significance of the accumulation of these gangliosides has been demonstrated in mice lacking GM3 synthase which generates the major ganglioside precursor. These mice are protected from insulin resistance and glucose intolerance when fed a high-fat diet. Treatment of genetically obese or diet-induced obese mice with highly specific glucosylceramide synthase (GCS) inhibitors results in improved glucose tolerance and increased insulin sensitivity in muscle and liver. Collectively, these studies strongly implicate a role for glucosylated ceramides in increased adipose tissue inflammation, peripheral insulin resistance, and hepatic steatosis.
The most potent reagent used to study the effects of the manipulation of enzymes involved in sphingolipid biosynthesis is the compound myriocin [2-Amino-3,4-dihydroxy-2-(hydroxymethyl)-14-oxoicos-6-enoic acid]. Myriocin is a highly specific inhibitor of serine palmitoyltransferase (SPT), which is the first and rate-limiting enzyme in the de novo pathway of ceramide synthesis. See the Figure above showing sphingosine and ceramide synthesis. Myriocin (also known as antibiotic ISP-1 and thermozymocidin) was isolated from thermophilic fungi such as Mycelia sterilia and Isaria sinclairii. Extracts from these fungi have been used in traditional Chinese medicine as a treatment for numerous conditions including diabetes. Myriocin can be administered chronically to rodents and it appears to be well tolerated. Addition of myriocin to animals that are models of obesity prevents insulin resistance and the development of diabetes, atherosclerosis, and cardiomyopathy. In addition, myriocin improves glucose tolerance, insulin sensitivity and ameliorates hypertension when administered to rodents.
Genetic manipulation of several enzymes in ceramide metabolism has also been shown to insulin sensitizing. In mice heterozygous for the SPT subunit SPTLC2 (serine palmitoyltransferase, long-chain base subunit 2) there is a reduction in peripheral ceramide levels and improved insulin sensitivity when these animals are fed a high-fat diet. Similar results are seen in mice heterozygous for dihydroceramide desaturase-1 (DES1). Both SPT and DES1 are required for ceramide biosynthesis. As described above, a large family of ceramide synthases (CerS) have been identified in mammals. CerS1 is the most abundant isoform expressed in skeletal muscle and is involved primarily in the synthesis of C18:0 ceramides. The level of expression of CerS1 was shown to be significantly elevated in mice fed a high-fat diet. This increase in CerS1 expression was associated with alterations in ceramide levels and reduced glucose tolerance.
Collectively these data demonstrate a complex interrelationship between sphingosine and ceramide metabolism and insulin resistance. As pointed out ceramides can be deacetylated by ceramidases to form sphingosine. As discussed below, sphingosine can be phosphorylated to S1P which is an important biologically active lipid. Ceramides can also be glucosylated by glucosylceramide synthase (GCS) forming glucosylceramides which then serve as the building blocks of complex glycosphingolipids; they can act as substrates for the sphingomyelin synthases yielding sphingomyelins; or they can be phosphorylated by ceramide kinase to yield ceramide-1-phosphate. Thus, it is clear that multiple products of the actions of SPT, CerS, and DES1 could all potentially contribute to the development of insulin resistance and diabetes.
As pointed out earlier, obesity is associated with a low-grade systemic inflammatory state. One of the mechanisms involved in this inflammatory status is the activation of toll-like receptors (TLRs). TLR activation leads to enhanced transcription of pro-inflammatory cytokines such as TNFα and interleukin-6 (IL-6). Saturated fatty acids are known to activate TLR4 and this activation is requisite for lipid induction of TNFα and other cytokines. When TLRs are knocked-out in mice the animals are protected from lipid-induced insulin resistance. The signal transduction cascade initiated by TLR activation involves the downstream effectors IKKβ and NFκB. TLR4 activation has been shown to selectively and strongly increase the levels of sphingolipids within cells. Several studies have shown that ceramide is indeed an obligate intermediate linking TLR4 activation to the induction of insulin resistance.
Insulin Resistance Effected by Hexosamines (O-GlcNAcylation)
The details of the hexosamine biosynthesis pathway (HBP) and its role in metabolism and development can be found in the Glycoproteins: Synthesis and Clinical Consequences page.
Numerous proteins involved in insulin signaling and the downstream targets of these signaling cascades have been shown to be O-GlcNAcylated. With respect to insulin receptor signaling proteins, insulin receptor substrate-1 (IRS-1), phosphatidylinositol-3-kinase (PI3K), protein kinase B/AK strain transforming (AKT/PKB), PIP3-dependent kinase 1 (PDPK1), and glycogen synthase kinase 3β (GSK3β) are all known to be O-GlcNAcylated. These modifications have all been observed in adipocytes which are a major target for the actions of insulin.
Insulin-stimulated glucose uptake into adipocytes occurs via insulin-mediated mobilization of GLUT4 to the plasma membrane. Increased glucose uptake, in response to insulin, can therefore, significantly modify the rate of flux through the HBP. Evidence linking the correlation between the HBP and insulin resistance in adipocytes was demonstrated at least 20 years ago. Using cultured rat adipocytes experiments demonstrated that chronic exposure to both insulin and glucose was required for the adipocytes to become insulin-resistant. This is now a common theme underlying insulin resistance in other insulin-sensitive tissues such as skeletal muscle.
In these early experiments is was shown that the impairment in insulin-stimulated glucose uptake, under hyperglycemic and hyperinsulinemic conditions, was exclusively dependent on the presence of the amino acid glutamine. Glutamine is required as a substrate for GFAT, the rate-limiting enzyme in the HBP. Inhibition of GFAT activity was observed in the hyperglycemic and hyperinsulinemic conditions likely due to feedback inhibition by UDP-GlcNAc as the HBP product was shown to accumulate in the treated cells. However, if GFAT was inhibited, with the use of various amidotransferase inhibitors, the hyperglycemia-induced insulin resistance was prevented.
Additionally, if cells are treated with glucosamine, which enters the HBP after the GFAT catalyzed reaction, there was a greater reduction in insulin-mediated glucose uptake compared to the hyperglycemic condition. As expected, since GFAT is bypassed, the glucosamine-induced insulin resistance does not require glutamine. Although glucose and glutamine metabolism are key inducers of the flux through the HBP, free fatty acids (FFA) and uridine are also potent modulators of the HBP.
Utilizing experiments in whole animals, as opposed to cell culture, has provided additional direct evidence that excess flux through the HBP leads to modulation of insulin sensitivity in adipocytes. When GFAT is overexpressed in mice under the control of a GLUT4 promoter the animals develop classical insulin-resistant phenotype with hyperinsulinemia and reduction in whole-body glucose disposal rate. Because GLUT4 is highly expressed in adipose tissue and skeletal muscle, two major insulin-responsive tissues, it is not surprising that defective whole-body glucose disposal was observed. Elevation in serum leptin level was also observed in these GFAT overexpressing mice. Interestingly, muscle explants from GLUT4-GFAT mice showed normal insulin-stimulated glucose uptake. This latter observation is strong evidence that adipocytes play a major regulatory role in the HBP-mediated whole-body insulin resistance.
Another strain of mice has been utilized for studies on the role of HBP in insulin sensitivity that express GFAT specifically in adipose tissue by the use of an aP2 (adipocyte lipid binding protein) promoter driving its expression. Adipose tissue-restricted elevations in O-GlcNAc levels are detected in these mice and this is associated the development of whole-body insulin resistance. The results in these animals is characterized by a reduction in both glucose disposal rate and skeletal muscle glucose uptake. An increase in serum leptin and a decrease in serum adiponectin levels were also found in these mice.
As pointed out above, numerous proteins downstream of the insulin receptor that are critical to insulin-mediated signal transduction are known to be O-GlcNAcylated. Therefore, it is not difficult to assume that HBP-mediated glucose desensitization will occur at multiple stages, in particular through insulin-mediated signal transduction. Under high glucose-induced insulin resistance, there is a reduction in insulin-stimulated phosphorylation of AKT/PKB. There have been some discrepancies in determining precisely how the HBP flux affects AKT/PKB phosphorylation in response to insulin binding its receptor.
Recent research has shown that when cells are exposed to chronically high glucose and insulin there is a concomitant reduction in PIP3 which is a product of activated PI3K, a target of the activated insulin receptor. This reduction in PIP3 levels is correlated with an increase in PTEN (phosphatase and tensin homolog deleted on chromosome 10) levels. PTEN is a known inhibitor of PI3K. In addition, it was shown that there is an increase in IRS-1 phosphorylation on Ser636 and Ser639. Since rapamycin treatment inhibits the alteration of PIP3 and PTEN levels under insulin-resistant conditions, it is believed that the mTORC1 is involved in negatively regulating the IRS-1/PI3K/AKT signaling cascade downstream of the insulin receptor. The sites on IRS-1 seen to be phosphorylated by chronic hyperglycemic and hyperinsulinemic conditions (S636/S639) are known to be substrates of mTORC1.
The regulation of insulin-stimulated GLUT4 translocation is also affected by changes in the flux rate through the HBP. Several cytoskeletal proteins involved in mobilization of GLUT4 to the plasma membrane are known to be O-GlcNAcylated. In addition, several of the proteins involved in the translocation process are targets of signaling proteins downstream of the insulin receptor. In cell culture models of both glucose- and glucosamine-induced insulin-resistance a reduction in the acute insulin-stimulated GLUT4 translocation is associated with a significant alteration in membrane redistribution of vesicle proteins such as t-(target membrane) SNARE, v-(vesicle membrane) SNARE and Munc18c (mammalian uncoordinated). SNARE stands for soluble-N-ethylmaleimide-sensitive factor attachment protein receptor. Munc18c is a negative regulator of both t- and v-SNAREs. Munc18c is known to be a target for O-GlcNAcylation. These results suggest a direct involvement of excess HBP flux in desensitizing the fusion between GLUT4-containing intracellular vesicles and the plasma membrane.
In addition to GLUT4 translocation, insulin-mediated PI3K and AKT/PKB activation also stimulates glycogen synthesis. The net effect is to balance the level of glucose metabolism in response to excess glucose influx. Insulin-dependent glycogen synthesis is mediated via the activation of of glycogen synthase (GS). Like other downstream targets of the insulin receptor, GS regulation involves a AKT/PKB-mediated inhibition of GSK3β which normally phosphorylates and inhibits GS. The insulin-stimulated increase in glycogen synthesis decreases the pool of G6P and subsequently F6P, thereby restricting flux through the HBP. AKT/PKB activation also leads to reduced dephosphorylation of GS via protein phosphatase 1 (PP1). Exposing cells to either high glucose or glucosamine results in a reduction in insulin-stimulated GS activity. Additionally, GS is a known O-GlcNAcylated protein and as might be expected it has been shown that GS becomes more resistant to dephosphorylation by PP1 under conditions of excess HBP flux.
While increased global O-GlcNAc levels are implicated in the development of insulin resistance, OGT is also regulated by insulin in adipocyte cell cultures. OGT is tyrosine-phosphorylated by the insulin receptor upon acute insulin stimulation and this phosphorylation increases the activity of the enzyme. In addition there is an observed shift in OGT localization from the nucleus to the cytosol in response to insulin stimulation. This OGT translocation to the plasma membrane is PI3K-dependant in response to acute insulin stimulation.
In summary, given that genetic and pharmacologic elevation in O-GlcNAc levels in cultured adipocytes and mouse models is associated with insulin-resistant phenotypes, it is likely that reducing O-GlcNAc levels in adipocytes should reverse the HBP-induced insulin resistance. A proof-of-concept experiment in transgenic mice (the insulin-resistant db/db mouse model which harbors a mutated leptin receptor) showed that overexpression of OGA, which reduces the level of O-GlcNAcylation, significantly improves whole-body glucose tolerance and insulin sensitivity. This result suggests that lowering O-GlcNAc levels in vivo should be of significant clinical beneficial.
Insulin Regulation of Endothelial Cell Functions
The metabolic functions of insulin are primarily reflective of its role in glucose and lipid homeostasis in skeletal muscle, adipose tissue, and liver. However, insulin also exerts important functions in other non-classical insulin target tissues such as the brain, pancreas, and the vascular endothelium. The ability of insulin to exert vasodilator action in the vascular endothelium as a result of increased nitric oxide (NO) production is an important component of the ability of this hormone to enhance glucose uptake by skeletal muscle. The insulin-mediated signaling pathway that triggers production of NO in vascular endothelium involves the same signaling proteins (PI3K, PDPK1, and AKT/PKB) that are components of metabolic regulatory pathways induced by insulin. Therefore, it is understandable why the same disruptions to insulin signaling that lead to insulin resistance (IR) caused by excess free fatty acids (FFA) and hyperglycemia result in endothelial dysfunction.
The production of NO in endothelial cells is the result of the activation of endothelial nitric oxide synthase (eNOS). The production and actions of NO and the various NOS involved are discussed in more detail in the Amino Acid Derivatives: Neurotransmitters, Nitric Oxide, and More page. With respect to insulin action, the activation of endothelial AKT/PKB leads to phosphorylation and activation of eNOS and thus increased NO production. In addition to modulating vascular tone by activating signaling events in the underlying vascular smooth muscle cells, endothelial cell-derived NO reduces the production of pro-inflammatory cytokines, reduces leukocyte and monocyte recruitment and adhesion to the endothelium, inhibits the proliferation of vascular smooth muscle cells, inhibits apoptosis, and attenuates platelet aggregation. Inactivation of endothelial cell NO production, as occurs due to IR, results in endothelial dysfunction and promotes the development of atherosclerosis. As described above for the liver and adipose tissue, elevated levels of circulating FFAs lead to impaired insulin signaling via the PI3K-PDPK1-AKT/PKB pathway in vascular endothelial cells.
Insulin exerts its mitogenic, growth promoting, and differentiation effects via a signaling pathway that involves mitogen-activated protein kinase (MAPK) which is distinct from the PI3K-PDPK1-AKT/PKB pathway that is involved in metabolic regulation by insulin. The MAPK-induced pathway does not play a role in the production of NO by insulin. This MAPK-induced pathway plays a significant role in the development of atherosclerosis in the IR state. When insulin signaling via PI3K-PDPK1-AKT/PKB is impaired, as described above for the insulin resistant (IR) state, the MAPK signaling pathway in endothelial cells is enhanced.
In the endothelium MAPK activation by insulin results in increased expression of endothelin-1 (ET-1), plasminogen activator inhibitor type-1 (PAI-1), and the adhesion molecules intercellular adhesion molecule-1 (ICAM-1), vascular cell adhesion molecule-1 (VCAM-1), and E-selectin. ET-1 is a potent vasoconstrictor and contributes to endothelial cell dysfunction in the presence of IR. The increased expression of numerous cell adhesion molecules accelerates the adherence to the endothelium of pro-inflammatory leukocytes which in turn contributes to the development of atherosclerosis. Therefore, the molecules beneficial to vascular endothelial health that are induced by insulin (e.g. NO) are reduced in the IR state and those that are proatherogenic (e.g. ET-1, PAI-1) are increased.