
Last Updated: July 7, 2026
Introduction
Glycolysis represents one of the most important metabolic processes in the human body. Glycolysis is the pathway by which the carbohydrate, glucose, is oxidized for the production of ATP energy. All cell have the capacity to carry out glycolysis, with the pathway being critical to the survival of red blood cells given that these cells lack mitochondria and therefore, can attain ATP only from glucose oxidation.
Glucose that is oxidized by cells can be derived from the dietary digestion of more complex carbohydrates, or it can be released from the intracellular storage molecule, glycogen.
Digestion of Dietary Carbohydrates
The majority of glucose that is utilized to maintain blood glucose levels and that is oxidized in the pathway of glycolysis comes from the digestion of dietary carbohydrates. Dietary carbohydrates enter the body in complex forms, such as disaccharides and the polymers starch (amylose and amylopectin) and glycogen. The polymer cellulose is also consumed but not digested. The major disaccharides found in the human diet are sucrose, lactose, and maltose. Sucrose is composed of glucose and fructose. Lactose (often referred to as milk sugar) is composed of glucose and galactose. Maltose is composed of two molecules of glucose.
The first step in the metabolism of digestible carbohydrate is the conversion of the higher polymers to the simpler, soluble monosaccharide forms that can be transported into the intestinal enterocytes and then transported to the blood and delivered to the tissues. The breakdown of polymeric sugars begins in the mouth. Saliva has a slightly acidic pH of 6.8 and contains salivary α-amylase that begins the digestion of carbohydrates by hydrolyzing glucose present in α-1,4 glycosidic linkages. The action of salivary amylase is limited to the area of the mouth and the esophagus as it is virtually inactivated by the much stronger acid pH of the stomach. Once the food has arrived in the stomach, acid hydrolysis contributes to its degradation; specific gastric and pancreatic proteases and lipases aid this process for proteins and fats, respectively. The mixture of gastric secretions, saliva, and food, known collectively as chyme, moves to the small intestine.
The main polymeric carbohydrate digesting enzyme of the small intestine is α-amylase. This enzyme is secreted by the pancreas and has the same activity as salivary α-amylase, producing disaccharides and trisaccharides. The latter are converted to monosaccharides by intestinal saccharidases, including maltase that hydrolyzes di- and trisaccharides composed of glucose, and the more specific disaccharidases, sucrase-isomaltase, lactase (β-galactosidase), and trehalase. The net result is the almost complete conversion of digestible carbohydrate to its constituent monosaccharides.
Sucrase-isomaltase, as its name implies, has two distinct activities. The sucrase activity hydrolyzes sucrose into free glucose and fructose. Isomaltose is a disaccharide of two glucose molecules joined via an α-1,6 glycosidic bond. The primary source of isomaltase is through the action of α-amylase on starches since α-amylase cannot hydrolyze α-1,6 glycosidic bonds. The isomaltase activity hydrolyzes isomaltose into free glucose.
Lactase is a member of the β-galactosidase family of enzymes and is active on numerous substrates. The primary substrate of lactase is lactose which it hydrolyzes to free galactose and glucose. The phlorizin hydrolase activity of the enzyme hydrolyzes glucose and galactose containing lactosylceramide, GM1 gangliosides, and β-galactoside containing glycoproteins.
Trehalose is a disaccharide containing two glucose molecules linked via an α-1,1 glycosidic linkage. Trehalose is found in bacteria, fungi, plants, and invertebrates. Trehalase hydrolyzes glucose from trehalose.
The resultant monosaccharides, glucose, fructose, and galactose, are transported into the intestinal enterocytes via the actions of various carbohydrate transporters. Glucose is transported into enterocytes via the action of two transporters. One of these transporters is the Na+-dependent glucose transporter 1 (SGLT1) while the other is the Na+-independent glucose transporter 2 (GLUT2). SGLT1 is the major transporter of glucose from the lumen of the small intestine. Although GLUT2 does indeed transport glucose into intestinal enterocytes, this only occurs in response to glucose-mediated translocation of intracellular vesicle-associated GLUT2. Thus, even in the absence of GLUT2 (such as is the case of individuals with Fanconi-Bickel disease), intestinal uptake of dietary glucose is unimpaired.
Galactose is also absorbed from the gut via the action of SGLT1. Fructose is absorbed from the intestine via GLUT5 uptake. Indeed, GLUT5 has a much higher affinity for fructose than for glucose.
Glucose and galactose are then transported out of the enterocyte into the circulation via the action of enterocyte GLUT2 present in the basolateral membrane, whereas fructose is transported to the blood via the action of the GLUT5 transporter. Following entry into the duodenal superior mesenteric vein, the dietary sugars travel to the hepatic portal vein and then to liver parenchymal cells and other tissues of the body. Within cells, the monosaccharides are oxidized by the various catabolic pathways of cells or they can be used as precursors for biomass production or the excess glucose can be stored as glycogen.
Although limited in the diet in comparison to glucose, fructose, and galactose, mannose also contributes to numerous important metabolic processes. Dietary mannose, in the free state, is obtained primarily from fruits, berries, and legumes. Small amounts of mannose are obtained from heteropolymers such as galactomannans following digestion by intestinal bacteria as well as from ingested glycoproteins.
Mannose is taken up into intestinal enterocytes and delivered to the circulation via GLUT-mediated transport and also transported into cells via GLUT transporters. Whether a particular GLUT is specific for mannose has yet to be determined. Once inside cells mannose is phosphorylated to mannose-6-phosphate via hexokinases.
Mannose-6-phosphate is utilized in the N-glycosylation and O-mannosylation of proteins following its conversion to mannose-1-phosphate by phosphomannomutase (PMM2) followed by activation to GDP-mannose. Mannose-6-phosphate is also a substrate for mannose phosphate isomerase (MPI) which interconverts mannose-6-phosphate and fructose-6-phosphate. Indeed, approximately 90% of ingested mannose is converted to fructose-6-phosphate via the actions of MPI.
Conversion of mannose-6-phosphate to fructose-6-phosphate allows mannose to directly contribute to energy production via the glycolytic pathway. In addition to oxidation via glycolysis, mannose converted to fructose-6-phosphate can also contribute to carbon storage as glycogen.
The conversion of mannose-6-phosphate to fructose-6-phosphate also allows mannose to contribute to the synthesis of UDP-GlcNAc via the hexosamine biosynthesis pathway. Physiological significance of the incorporation of mannose into the pathway of protein O-GlcNAcylation has been demonstrated in T-cells where this pathway enhances T-cell anti-tumor activity as a result of increased O-GlcNAcylation of β-catenin.
Glucose Transporters
One major response of non-hepatic tissues to insulin is the recruitment, to the cell surface, of glucose transporter complexes, specifically the GLUT4 transporter. Glucose transporters are members of a large family of sugar transporters comprised of at least 14 members. Most transporters in the family a designated by the GLUT nomenclature, however, not all GLUT transporters in this family transport glucose.
The most well characterized members of the family are GLUT1, GLUT2, GLUT3, GLUT4, and GLUT5. The glucose transporters are facilitative transporters that carry hexose sugars across the membrane without requiring energy. These transporters belong to a family of proteins called the solute carriers. Specifically, the official gene names for the GLUT are solute carrier family 2 (facilitated glucose transporter) member. Thus, the GLUT1 gene symbol is SLC2A1, GLUT2 is SLC2A2, GLUT3 is SLC2A3, GLUT4 is SLC2A4 and GLUT5 is SLC2A5.
The GLUT family of transporters can be divided into three classes based upon primary amino acid sequence comparisons. Class I transporters include GLUT1, GLUT2, GLUT3 (and the gene duplication of GLUT3 identified as GLUT14), and GLUT4. Class II transporters include GLUT5, GLUT7, GLUT9, and GLUT11. Class III transporters include GLUT6, GLUT8, GLUT10, GLUT12, and HMIT [proton (H+) myoinositol symporter]. HMIT is also known as GLUT13 and is encoded by the SLC2A13 gene.
GLUT1 is ubiquitously distributed in various tissues with highest levels of expression seen in brain, pancreatic β-cells, placenta, and erythrocytes. In fact, in erythrocytes GLUT1 accounts for almost 5% of total protein. The Km of GLUT1 for glucose is around 1-2mM. Although widely expressed, GLUT1 is not expressed in hepatocytes. GLUT1 is the primary transporter responsible for glucose transport across the blood-brain-barrier. Deficiencies in GLUT1 results in GLUT1 deficiency syndrome. Evidence has shown that one of the cell surface binding sites for the human T cell leukemia virus (HTLV) is GLUT1.
GLUT2 is found primarily in the intestines, kidney, and liver. The Km of GLUT2 for glucose (15mM–20mM) is the highest of all the sugar transporters. The high Km ensures a fast equilibrium of glucose between the cytosol and the extracellular space ensuring that liver does metabolize glucose until its levels rise sufficiently in the blood. Expression of GLUT2 in the kidney plays a major role in overall systemic glucose homeostasis. GLUT2 molecules can transport both glucose and fructose.
Whereas GLUT2 is a major glucose transporter in rodent pancreatic β-cells, this is not the case in humans. Human pancreatic β-cells express both GLUT1 and GLUT3. Although there is evidence to suggest that GLUT2 is expressed in human pancreatic β-cells, it is not a critical glucose transporter in this tissue.
GLUT3 is found primarily in neurons but also expressed in the intestines and pancreatic β-cells. GLUT3 binds glucose with high affinity exhibiting a Km for glucose of ~1.4mM making it lowest Km of the GLUTs. This high affinity for glucose allows neurons to have enhanced access to glucose especially under conditions of low blood glucose.
Insulin-sensitive tissues, such as skeletal muscle and adipose tissue, contain GLUT4 whose mobilization to the cell-surface is stimulated by insulin action. The Km of GLUT4 for glucose is moderately high at around 5mM. GLUT4 expression is also found in the brain and the heart.
GLUT5, and the closely related transporter GLUT7, are involved in fructose transport. GLUT5 is expressed in the intestines, kidney, testes, skeletal muscle, adipose tissue, and brain. Although GLUT2, -5, -7, 8, -9, -11, and -12 can all transport fructose, GLUT5 is the only transporter that exclusively transports fructose.
GLUT9 (SLC2A9) does not transport sugar but is a uric acid transporter abundant in the kidney and liver.
There are two additional glucose transporters which are the Na+-dependent glucose transporters, SGLT1 and SGLT2 (described above in the Digestion of Dietary Carbohydrates section). The SGLT acronym refers to sodium-glucose linked transporter. Both SGLT1 and SGLT2 are members of the solute carrier 5 family, thus the gene encoding SGLT1 is SLC5A1 and that encoding SGLT2 is SLC5A2.
The SGLT1 and SGLT2 transporters are expressed in the enterocytes of the small intestine and within epithelial cells of the proximal tubules of the kidney. The Km of SGLT1 for glucose is ~0.4mM and that of SGLT2 is ~2.0mM.
Within the small intestine SGLT1 contributes to dietary glucose and galactose absorption as described above in the Digestion of Dietary Carbohydrates section.
Within the kidney, SGLT1 is expressed in the S3 segment of the tubule and SGLT2 is expressed in the S1 and S2 segments. The activity of renal SGLT2 accounts for over 90% of the glucose reabsorption by the kidney. Due to this activity, this transporter has become a pharmacologic target for the treatment of the hyperglycemia associated with type 2 diabetes.
Glycolysis
Oxidation of glucose is known as glycolysis. Glucose is oxidized to pyruvate or the pyruvate can be reduced to lactate. Under aerobic conditions, the dominant product in most tissues is pyruvate and the pathway is known as aerobic glycolysis. When oxygen is depleted, as for instance during prolonged vigorous exercise, the dominant glycolytic product in many tissues is lactate and the process is known as anaerobic glycolysis. Given that erythrocytes lack mitochondria, they cannot completely oxidize glucose-derived pyruvate and instead reduce the pyruvate to lactate which enters the blood for delivery to the liver where it is used for glucose synthesis via gluconeogenesis. Lactate is also a major carbon source driving TCA cycle activity not only in the liver but in many other tissues as well.
Brain Glycolysis
The brain, as an organ, accounts for less than 2% of total body weight, yet up to 25% of daily glucose oxidation occurs within this organ. This represents a significant glucose demand by the brain. When considering the brain as an organ of glucose consumption, it is important to understand that neurons, unlike the supporting glial cells, are not in direct contact with the blood and therefore, do not directly access glucose from the circulation.
Neurons utilize glucose primarily obtained via interactions with astrocytes, a type of glial cell. In addition to complete oxidation to CO2 and H2O, astrocytes also metabolize glucose to lactate. The lactate can then be utilized by neurons by oxidation to pyruvate (by lactate dehydrogenase) and the pyruvate oxidized to acetyl-CoA (by the pyruvate dehydrogenase complex, PDHc) for entry into the TCA cycle. Astrocytes also oxidize fatty acids to acetyl-CoA which can then serve as a source of ketone body synthesis within the astrocytes. These ketone bodies can also be utilized by neurons as an energy source.
The supply of oxidizable carbon, that is not glucose, from astrocytes to neurons, allows neurons to drive most of their acquired glucose into the pentose phosphate pathway. This pathway allows neurons to utilize glucose metabolism for the generation of NADPH which reduces the oxidative load of neurons, thus protecting them from damage.
The Energy Derived from Glucose Oxidation
Aerobic glycolysis of glucose to pyruvate, requires two equivalents of ATP to activate the process, with the subsequent production of four equivalents of ATP and two equivalents of NADH. Thus, conversion of one mole of glucose to two moles of pyruvate is accompanied by the net production of two moles each of ATP and NADH.
Glucose + 2 ADP + 2 NAD+ + 2 Pi → 2 Pyruvate + 2 ATP + 2 NADH + 2 H+
Free Energy (ΔGo’) of Reactions of Hepatic Glycolysis
Enzyme Name | ||
Glucokinase | -19.4 | -4.6 |
Phosphoglycerate isomerase | +2.8 | +0.7 |
6-Phosphofructo-1-kinase: PFK1 | -15.6 | -3.7 |
Aldolase A | +24.6 | +5.9 |
Glyceraldehyde-3-phosphate dehydrogenase: GAPDH | +2.6 | +0.6 |
Phosphoglycerate kinase 1 | -19 | -4.5 |
Phosphoglycerate mutase 1: PGAM1 | +6.4 | +1.5 |
Enolase | +4.5 | +1.1 |
Pyruvate kinase | -27.2 | -6.5 |
free energy values were obtained from Li et al. (2010) “A Database of Thermodynamic Quantities for the Reactions of Glycolysis and the Tricarboxylic Acid Cycle” JPhysChemB 114(49) pp 16068-16082
The NADH generated during glycolysis is used to fuel mitochondrial ATP synthesis via oxidative phosphorylation, producing either two or three equivalents (approximately) of ATP depending upon whether the glycerol phosphate shuttle or the malate-aspartate shuttle is used to transport the electrons from cytoplasmic NADH into the mitochondria. The glycerol phosphate shuttle is the principal shuttle mechanism used in adipose tissue, skeletal muscle, and brain, whereas the liver, heart, and kidneys primarily utilize the malate-aspartate shuttle.
Accurate measurements carried out in the early 1990’s demonstrated that the true yield of ATP from NADH and FADH2 is closer to 2.5 moles of ATP per mole of NADH and 1.5 moles of ATP per mole of FADH2. However, many texts still utilize the historical values of 3 moles of ATP per mole of NADH and 2 moles of ATP per mole of FADH2. As such the values used in this page will be the historical values.
The Malate-Aspartate Shuttle
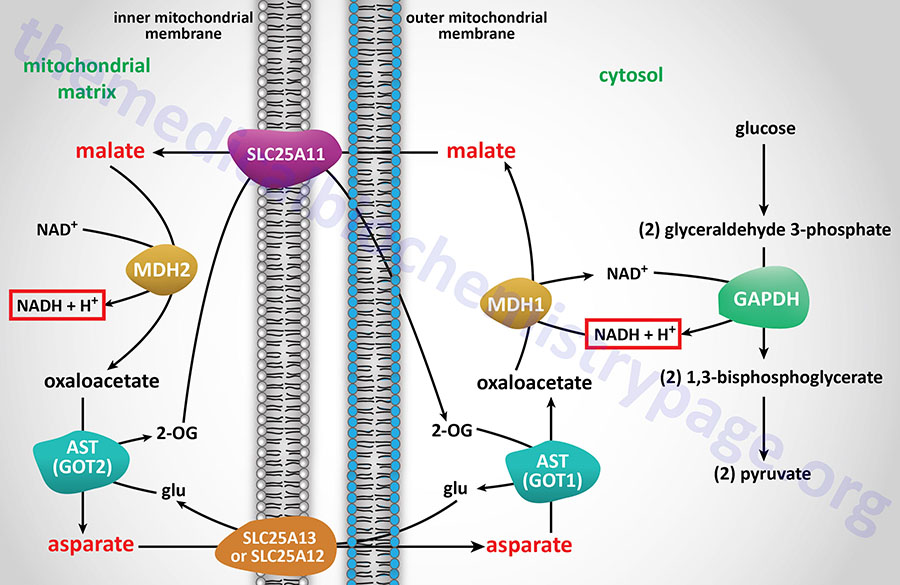
The malate-aspartate shuttle is one of two major pathways for the transfer of the electrons, carried by cytosolic NADH, into the mitochondria. This shuttle predominates in the liver, heart, and kidneys. The electrons of cytosolic NADH are carried into the mitochondria in the form of malate. Within the brain the malate-aspartate shuttle represents the major redox shuttle.
Cytoplasmic malate dehydrogenase (encoded by the MDH1 gene) reduces oxaloacetate (OAA) to malate while oxidizing NADH to NAD+. Malate is then transported into the mitochondria through the action of the SLC25A11 encoded transporter. When malate enters the mitochondria the reverse reaction is carried out by mitochondrial malate dehydrogenase (encoded by the MDH2 gene).
The MDH1 gene is located on chromosome 2p15 and is composed of 10 exons that generates three alternatively spliced mRNAs. The major MDH1 mRNA generates two protein isoforms as a result of the use of alternative in-frame translation stop codons. The shorter protein, which is derived by utilization of the upstream of two UGA codons, is a 334 amino acid protein. The longer protein, identified as MDH1x, is generated by read-through translation with termination at a downstream UGA codon. The MDH1x protein, which contains Arg or Trp at the position of the upstream UGA, is localized to the peroxisomes. MDH1x protein represents around 4% of malate dehydrogenase in the cell.
The MDH2 gene is located on chromosome 7q11.23 and is composed of 10 exons that generate three alternatively spliced mRNAs, each of which encodes a distinct protein isoform.
The transfer of mitochondrial OAA to the cytoplasm, necessary to maintain the malate-aspartate shuttle, requires it to be transaminated to aspartate (Asp, D). The transamination, catalyzed by AST, utilizes glutamate (Glu, E) as the amino donor and yields 2-oxoglutarate (α-ketoglutarate). The Asp is then transported from the mitochondria to the cytoplasm.
The principal mitochondrial aspartate transporter is an antiporter where glutamate is transported into the mitochondria in exchange for aspartate. Humans express two aspartate-glutamate antiporters that are encoded by the SLC25A12 and SLC25A13 genes. These antiporters are identified as AGC1 (aspartate-glutamate carrier 1) and AGC2, respectively. AGC1 and AGC2 are members of a family of Ca2+-dependent mitochondrial carriers (CaMC).
The SLC25A12 (AGC1) gene is located on chromosome 2q31.1 and is composed of 19 exons that encode a protein of 678 amino acids. Expression of the SLC25A12 gene predominates in the brain, skeletal muscle, and the heart.
The SLC25A13 (AGC2) gene is located on chromosome 17q21.3 and is composed of 21 exons that generate two alternatively spliced mRNAs encoding proteins of 676 amino acids (isoform 1) and 675 amino acids (isoform 2). Expression of the SLC25A13 gene predominates in the liver.
AGC1 is also known as aralar and AGC2 is also known as citrin. The name “aralar” was derived from the name of the scientist (Araceli del Arco) who originally cloned the cDNA and the fact that the protein has a long N-terminal extension (hiperlargo; Spanish for hyperlong) compared to other mitochondrial carriers.
Mutations in the SLC25A12 gene are associated with a rare form of infantile onset epilepsy identified as Early Infantile Epileptic Encephalopathy-39, EIEE 39. EIEE 39 is associated with epilepsy, hypotonia, impaired psychomotor neurodevelopment, and hypomyelination. Biochemical characteristics of EIEE 39 include significantly reduced levels of Asp and N-acetylaspartate (NAA) in the brain.
Citrin functions primarily in the urea cycle and its name is derived from the disease, citrullinemia type 2 (CTLN2), that is caused by mutations in the SLC25A13 gene..
The deamination of glutamate, within the mitochondria, generates 2-oxoglutarate, 2-OG, (α-ketoglutarate) which is transported out of the mitochondria in exchange for malate via the action of the SLC25A11 encoded transporter.
All the participants in the malate-aspartate shuttle are present in the proper cellular compartment for the shuttle to function due to concentration dependent movement. When the energy level of the cell rises the rate of mitochondrial oxidation of NADH to NAD+ declines and therefore, the shuttle slows.
Role of the Malate Aspartate Shuttle in Epigenetics
Under conditions of enhanced cell growth, in particular in most cancers, the level of activity of numerous metabolic enzymes can be altered. Many cancers, particularly glioblastomas, are associated with increased activity of the malate-aspartate shuttle as a consequence of increased expression of the MDH2 gene.
Under conditions of enhanced MDH2 activity, levels of 2-oxoglutarate, 2-OG (α-ketoglutarate) decrease due to increased conversion of 2-OG to 2-hydroxyglutarate (2-HG) by MDH2. Numerous demethylase enzymes are members of the 2-oxoglutarate and Fe2+-dependent dioxygenase family of enzymes. These demethylase are involved in the demethylation of DNA, mRNA, and histones, effects that alter the epigenetic profile of cells.
Reduced levels of 2-OG in cells, particularly in glioblastoma cells, has been shown to be accompanied by reduced activity of the mRNA demethylase encoded by the ALKBH5 gene. Reduced ALBKBH5 activity is in turn associated with enhanced cancer cell stemness.
The Glycerol Phosphate Shuttle
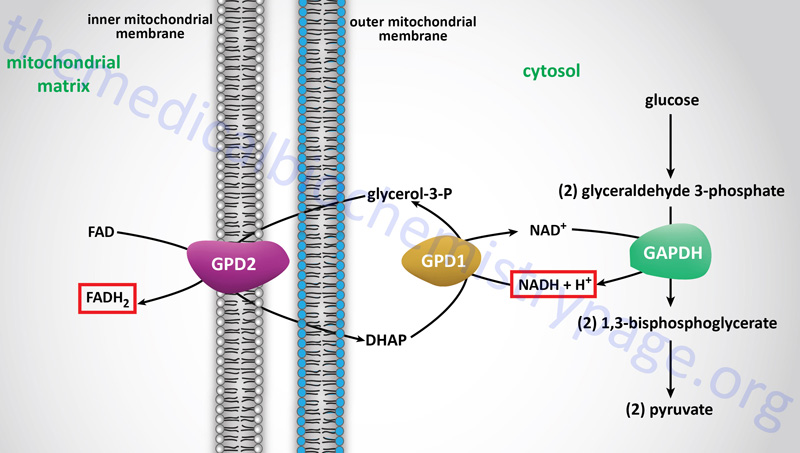
The glycerol-phosphate shuttle is one of the two major two major pathways for the transfer of the electrons, carried by cytosolic NADH, into the mitochondria. The glycerol-phosphate shuttle is the primary cytoplasmic NADH electron shuttle within cells of adipose tissue, skeletal muscle, and the brain.
The electrons from cytoplasmic NADH are carried into the mitochondria in glycerol-3-phosphate, hence the name of the shuttle. Cytoplasmic NADH is oxidized to NAD+ in the context of the reaction catalyzed by cytoplasmic glycerol-3-phosphate dehydrogenase, encoded by the GPD1 gene, which reduces dihydroxyacetone phosphate (DHAP) to glycerol-3-phosphate.
The glycerol-3-phosphate diffuses across the outer mitochondrial membrane and then interacts with the form of glycerol-3-phosphate dehydrogenase, encoded by the GPD2 gene, that resides in the inner mitochondrial membrane. At the inner mitochondrial membrane, glycerol-3-phosphate is oxidized back to DHAP by the GPD2 encoded enzyme. The electrons in the glycerol-3-phophate oxidized by the GPD2 encoded enzyme are transferred to FAD which is reduced to FADH2. Thus, the cytoplasmic electrons in NADH end up in the mitochondria in FADH2. These electrons can then enter the electron transport chain (ETC) at complex II of the ETC.
The GPD1 gene is located on chromosome 12q13.12 and is composed of 8 exons that generate two alternatively spliced mRNAs that encode proteins of 349 amino acids (isoform 1) and 326 amino acids (isoform 2).
The GPD2 gene is located on chromosome 2q24.1 and is composed of 26 exons that generate two alternatively spliced mRNAs, both of which encode the same 727 amino acid precursor protein.
The Individual Reactions of Glycolysis
In order to oxidize glucose it must be activated and the activation steps, up to the generation of fructose-1,6-bisphosphate, consume two moles of ATP. Therefore, the net yield from the oxidation of one mole of glucose to two moles of pyruvate is two moles of ATP and two moles of NADH. Within the mitochondria the electrons in cytoplasmic NADH will yield 4 or 6 moles of ATP dependent upon the mitochondrial shuttle mechanism utilized.
Complete oxidation of the two moles of pyruvate, through the actions of the pyruvate dehydrogenase complex (PDHc) and the reactions of TCA cycle, yields an additional 30 moles of ATP. The total yield, therefore, of the complete oxidation of one mole of glucose to CO2 and H2O is either 36 or 38 moles of ATP. Keep in mind that these ATP yield values are obtained using the historical yield values for moles of ATP per mole of NADH and FADH2. Utilizing the newer values of ATP yield, one mole of glucose can yield either 30 or 32 moles of ATP upon complete oxidation.
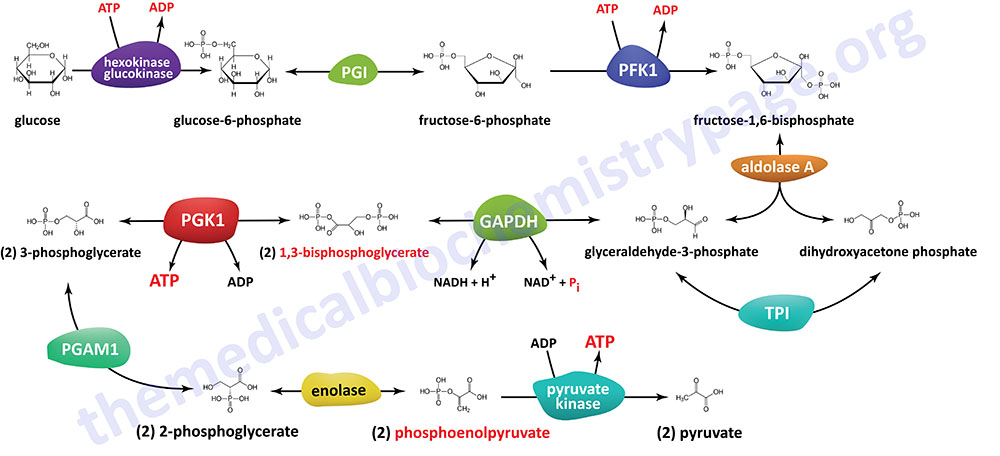
The pathway of glycolysis can be seen as consisting of two separate phases. The first is the chemical priming phase requiring energy in the form of ATP, and the second is considered the energy-yielding phase. In the first phase, two equivalents of ATP are used to convert glucose to fructose 1,6-bisphosphate (F1,6BP). In the second phase F1,6BP is oxidized to two moles of pyruvate, with the production of four equivalents of ATP and two equivalents of NADH.
Hexokinase Reaction
The ATP-dependent phosphorylation of glucose to form glucose 6-phosphate (G6P) is the first reaction of glycolysis, and is catalyzed by tissue-specific enzymes known as hexokinases. The phosphorylation accomplishes two goals: First, the hexokinase reaction converts non-ionic glucose into an anion that is trapped in the cell, since cells lack transport systems for phosphorylated sugars. Second, the otherwise biologically inert glucose becomes activated into a labile form capable of being further metabolized.
Humans express four genes encoding isozymes of ATP-dependent hexokinase. The encoded enzymes are designated as HK1, HK2, HK3, and HK4. A fifth member of the hexokinase family, identified as hexokinase domain containing 1 (encoded by the HKDC1 gene) is an RNA-binding protein as well as a protein-protein interacting partner.
The HK4 isoform is more commonly referred to as glucokinase and it is encoded by the GCK gene. All five mammalian hexokinases function as monomeric enzymes. Hexokinases 1, 2, and 3 can all phosphorylate other hexose sugars (at their normal physiological concentrations) in addition to glucose, whereas glucokinase (HK4) is only physiologically active towards glucose. Hexokinase 2 is the only enzyme of the family that possesses two catalytic domains, one at the N-terminus and another at the C-terminus. All the other hexokinases possess a single catalytic domain at the C-terminus.
The HK1, HK2, and HKDC1 proteins can be localized to the outer mitochondrial membrane and this occurs via an N-terminal mitochondrial binding domain which can bind to voltage-dependent anion channels (VDAC) in the mitochondrial outer membrane. During different metabolic demands the subcellular localization of HK1 and HK2 changes between the mitochondrial outer membrane and the cytosol.
With respect to HK1, the O-GlcNAcylation of the regulatory domain promotes the assembly of HK1 to the outer mitochondrial membrane. The synthesis of UDP-GlcNAc, the substrate of O-GlcNAc transferase (OGT), is enhanced by increasing levels of glucose which leads directly to an increase in the state of HK1 O-GlcNAcylation. Since O-GlcNAcylation of HK1 enhances association with the mitochondrial outer membrane, there is a direct correlation between glucose levels, increased glycolysis, and increased ATP production. The increased ATP production, coupled with HK1 association with the mitochondria, allows increased HK1 access to the ATP required for it to activate glucose for oxidation.
The rate of glycolysis is elevated under numerous metabolic conditions such as during exercise, in highly proliferative cells, and during inflammatory processes. Both HK1 and HK2 expression increases during activation of the inflammasome pathway. Inflammasomes are large multiprotein complexes localized to the cytosol that assemble in response to detection of infection- or stress-associated stimuli. The activation of inflammasomes results in the activation of caspase-1-mediated inflammatory responses and the initiation of an inflammatory form of cell death referred to as pyroptosis.
Activation of glycolysis via HK1-mediated phosphorylation of glucose is critical for inflammasome activation and is also involved in the activation of metabolic flux in the mitochondria in T-cells. In immune cells when HK1 is dissociated from the mitochondrial membrane there is a shift of glucose metabolism to the pentose phosphate pathway and this is correlated to increased immune modulating (cytokine) protein expression. The dissociation of HK1 from the mitochondria to the cytosol, and the associated increase in cytokine expression, is seen in disease states, particularly in diabetes, as well as during normal aging.
The HK1 gene is located on chromosome 10q22.1, spans 75 kb, and is composed of 29 exons that generate ten alternatively spliced mRNAs. These 10 mRNAs encode ubiquitously expressed and tissue-specific isoforms of the HK1 enzyme. The HK1 mRNA that encodes the ubiquitously expressed isoform encodes a 917 amino acid enzyme that contains a porin binding domain mediating association of the enzyme with the mitochondrial membrane. The HK1-R isoform is the erythroid-specific isoform and is a 916 amino acid enzyme that lacks the porin binding domain. There are four mRNAs that express the HK1-ta/tb isoform which is a 921 amino acid testes-specific isoform. The HK1-td isoform is also a testes-specific isoform of 905 amino acids. The other three mRNAs encode HK1 isoform a (952 amino acids), isoform b (889 amino acids), and isoform c (885 amino acids).
The HK2 gene is located on chromosome 2p12, spans 50 kb, and is composed of 20 exons that generate two alternatively spliced mRNAs encoding a 917 amino acid protein (isoform 1) and a 889 amino acid protein (isoform 2). Expression of the HK2 gene predominates in highly glycolytic cells such as adipose tissue, skeletal muscle, and heart as well as in highly proliferating cells, particularly in cancer cells. The elevated level of HK2 activity in proliferating cells results in increased production of lactate which promotes cancer cell proliferation.
The HK3 gene is located on chromosome 5q35.2 and is composed of 21 exons that encode a protein of 923 amino acids. Expression of the HK3 gene is ubiquitous with the highest levels in the bone marrow with levels that are nearly 10-times higher than in any other tissue.
The GCK (HK4) gene is located on chromosome 7p13 and is composed of 15 exons. As a result of alternative promoter usage and alternative splicing the GCK gene gives rise to seven different mRNAs and seven different protein isoforms. GCK isoform 1 is a pancreas specific enzyme of 465 amino acids. GCK isoform 2 is one of two liver-specific enzymes with this protein being the predominant form found in the liver. GCK isoform 2 is a 466 amino acid protein and the other liver-specific isoform, isoform 3, is a 464 amino acid protein. The other four GCK mRNAs (encoding isoforms 4, 5, 6, and 7) have, as yet, not been associated with tissue-specific patterns of expression. GCK expression predominates in liver, pancreas, small intestine, and the hypothalamus.
The HKDC1 gene is located upstream (5′) of the HK1 gene on chromosome 10q21.1. The HKDC1 gene is composed of 21 exons that encode a 917 amino acid protein that shares 70% amino acid sequence identity with HK1. The existence of HKDC1 was only recently (2007) identified with the use of genome-wide association studies (GWAS) of glucose homeostasis during pregnancy, specifically in the context of gestational diabetes mellitus. Four variants of the HKDC1 that were found to be associated with gestational diabetes were all within separate enhancers that cooperate to regulate expression of the HKDC1 gene. All four polymorphisms cooperate to reduce the expression level of the HKDC1 gene.
Normal expression of the HKDC1 gene is highest in the small intestines but is also differentially expressed in many other tissues. Elevated expression of the HKDC1 gene is found in numerous types of cancer and this is associated with poor prognosis such as is the case for hepatocellular carcinoma and squamous cell lung carcinoma (SQCLC).
As indicated, the HK1 isoform is ubiquitously expressed in most mammalian tissues. HK2 expression is normally restricted to insulin-sensitive tissues such as adipose tissue, skeletal, and cardiac muscle. However, high level HK2 expression is observed in cancer cells and this switch is associated with poor survival rates. Activated expression of HK2 in cancer cells is associated with a loss in expression of the tumor suppressor, p53. HK3 is normally expressed at low levels. As indicated, glucokinase (HK4) expression is essentially restricted to hepatocytes and pancreatic β-cells with low expression seen within the hypothalamus.
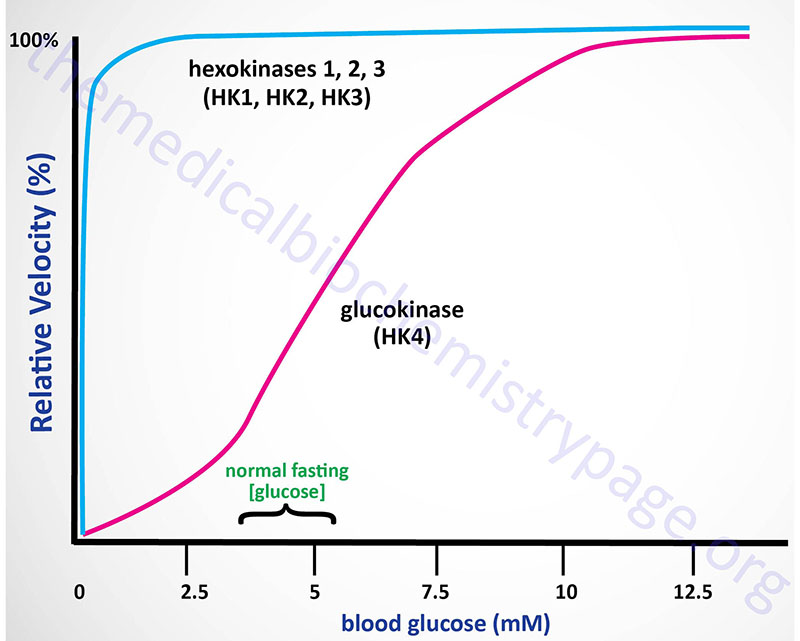
Kinetics of Hexokinases
The high Km of glucokinase for glucose means that this enzyme is saturated only at very high concentrations of substrate, i.e. only in the postprandial state.
Sigmoidal kinetics has been observed for other monomeric enzymes in cases of random addition of substrates, but this is not the case for glucokinase. The catalytic cycle for glucokinase involves an ordered addition of substrates where glucose is known to bind first followed by ATP binding. The mechanism of positive cooperativity observed for monomeric enzymes was indeed first proposed for glucokinase and is called the mnemonic model.
The mnemonic mechanism of cooperativity for glucokinase involves an equilibrium between two conformational states of the enzyme that exhibit vastly different glucose affinities. Within cells there is a large predominance of the low affinity conformation of glucokinase in the absence of glucose. As glucose concentrations rise, there is a slow interconversion between the conformational states with conversion from the low affinity to the high affinity state strongly accelerated upon glucose binding to the active site of the enzyme. Only the high affinity form of glucokinase is catalytically competent, and the rate of glucose phosphorylation is very fast compared to the rate of glucose-induced conformational change.
In addition to the unique kinetic parameters of glucokinase, compared to those of HK1, HK2, and HK3, glucokinase is also regulated through interaction with a regulatory protein (see the Regulation of Glycolysis section below), whereas the other three enzymes are not.
The high KM, for glucose, of hepatic glucokinase allows the liver to buffer blood glucose. After meals, when postprandial blood glucose levels are high, liver glucokinase is significantly active, which causes the liver preferentially to trap and to store circulating glucose. When blood glucose falls to very low levels, tissues such as liver and kidney, which contain glucokinases but are not highly dependent on glucose, do not continue to use the meager glucose supplies that remain available. At the same time, tissues such as the brain, which are critically dependent on glucose, continue to scavenge blood glucose using their low Km hexokinases, and as a consequence their viability is protected.
Under various conditions of glucose deficiency, such as long periods between meals, the liver is stimulated to supply the blood with glucose through the pathway of gluconeogenesis. The levels of glucose produced during gluconeogenesis are insufficient to activate glucokinase, allowing the glucose to be transported out of hepatocytes and into the blood.
Subcellular Localization of Hexokinases
The subcellular localization is also distinct for various hexokinase isoforms with HK1, HK2, and HKDC1, being associated with the outer mitochondrial membrane and the cytosol while GCK moves between the nucleus and the cytosol. The mitochondrial localization of HK1, HK2, and HKDC1 occurs through their interactions with the outer mitochondrial membrane channel protein known as voltage-dependent anion channel 1, VDAC1. VDAC1 is a member of the mitochondrial porin family of channels that confer permeability to the outer mitochondrial membrane. The interaction of HK1 with the actively phosphorylating mitochondria, and its selective use of intramitochondrial ATP as a substrate is thought to facilitate coordination of glycolysis with the terminal oxidative stages of glucose metabolism which occurs within the mitochondria. This would ensure that the rate of overall glucose oxidation is commensurate with cellular energy demands while also avoiding excessive production of lactate.
The primary mechanism of glucokinase regulation is its sequestration to the nucleus by the protein, glucokinase regulatory protein, GKRP (see the Regulation of Glycolysis section below for details). Although not physiologically inhibited by its product, hepatic glucokinase is inhibited by long-chain fatty acids (LCFA). In contrast, LCFA do not inhibit the other forms of hexokinase. The ability of LCFA to inhibit hepatic glucokinase is one of the mechanisms by which fatty acids inhibit glucose uptake into the liver. The inhibition of hepatic glucose uptake by LCFA is responsible, in part, for the hyperglycemia observed in obesity.
Regulation of Hexokinase Activity
The level of hexokinase activity, particularly but not exclusively in cancer cells, is regulated by transcriptional control, mRNA stability, by various post-translational modifications, and by product feed-back inhibition.
HK2 activity is regulated by its state of phosphorylation. Several kinases, such as AKT/PKB and SRC, are known to phosphorylate different hexokinases. AKT phosphorylates HK2 on threonine 473 (T473) which promotes the interaction of HK2 with the mitochondrial outer membrane increasing its access to ATP produced by oxidative phosphorylation. HK2 is also ubiquitylated which promotes its association with the mitochondrial outer membrane which enhances glycolysis and also promotes cancer stem cell proliferation. HK2 SUMOylation also enhances its association with the mitochondrial outer membrane, an effect that has been shown to promote prostate cancer cell proliferation as well as contribute to resistance to chemotherapy.
SRC phosphorylates HK1 on tyrosine 732 (Y732) which leads to disruption in dimer formation resulting in increased catalytic activity. In addition, the Y732 phosphorylation results in a decrease in the KM of HK1 for glucose resulting in an enhanced level of glucose phosphorylation.
Hexokinases 1, 2, and 3 are feed-back inhibited by physiological accumulation of the product (glucose-6-phosphate: G6P) of their reactions, whereas glucokinase is not inhibited by physiological levels of G6P. The binding of G6P to HK1 and HK2 causes a conformational change that results in dissociation of the proteins from the mitochondrial outer membrane and subsequent feed-back inhibition of glycolysis.
The relative lack of product inhibition of glucokinase further insures liver accumulation of glucose stores during times of glucose excess, while favoring peripheral glucose utilization when glucose is required to supply energy to peripheral tissues.
The activity of the hexokinases is also regulated by inorganic phosphate (Pi). HK2 and HK3 are further inhibited by Pi, whereas the G6P inhibition of HK1 is antagonized by low concentrations of Pi while high Pi concentrations contribute to further G6P inhibition of HK1.
Role of HK2 in Histone Lactylation and Liver Fibrosis
The normal response of the liver to injury is fibrosis, a permanent wound healing response that contributes to morbidity and mortality. In response to liver injury, quiescent hepatic stellate cells (HSC) are activated and induced to differentiate into alpha-smooth muscle actin (α-SMA)-positive myofibroblasts. The myofibroblasts are the dominant contributors to collagen-producing cells in fibrotic livers.
Increased production of lactate is a significant contributor the induction of α-SMA-positive myofibroblasts. Contributing to the increased lactate is increased activity of HK2. Changes in gene expression that are required for the differentiation of α-SMA-positive myofibroblasts result as a consequence of histone lactylation, specifically histone H3 lactylation.
Functions of HK2 in Glioblastoma
While attached to the mitochondrial outer membrane, HK2 inhibits the pro-apoptotic protein BAX which results in inhibition of apoptosis. Under conditions of increased glucose metabolism, as is typical in many types of cancer, the accumulating glucose-6-phopshate (G6P) binds to HK2 stimulating its release from the mitochondrial outer membrane.
With respect to the functions of HK2 and cancer cell proliferation it is important to note that most cancer cells metabolize fructose via HK2, as opposed to via ketohexokinase (KHK). This is particularly significant when glucose is limiting. In addition, the dramatic increases in fructose consumption in the US over the past 50 years is likely to be a significant contributor to the progression of numerous types of cancer, including glioblastomas.
In glioblastoma cells when HK2 is released to the cytosol it functions as a kinase and phosphorylates the protein IκBα (NF-κB inhibitor alpha. NF-κB is nuclear factor kappa-light-chain-enhancer of activated B cells. IκBα is encoded by the NFKBIA (NF-κB inhibitor, alpha) gene. The normal function of IκBα is to prevent NF-κB entry into the nucleus by blocking the nuclear localization sequences of the NF-κB protein. The phosphorylation of IκBα results in its degradation which prevents its interaction with NF-κB. The net effect is that NF-κB is able to enter the nucleus and activate the expression of target genes.
Within glioblastoma cells the NF-κB-mediated activation of transcription promotes tumor cell evasion of immune responses. The immune evasion of glioblastoma cells is a consequence of NF-κB-mediated increases in the expression of PD-L1 (programmed death-ligand 1; also known as cluster of differentiation 274, CD274). PD-L1 is a transmembrane protein that has been speculated to play a major role in suppressing adaptive immune responses.
Cytoplasmic HK2 also inhibits the mTORC1 which normally inhibits autophagy. Cytoplasmic HK2 enhances the activity of the protein, prominin-1 (also identified as CD133) which results in increased Oct4-mediated expression of tumor stemness genes.
Hypothalamic Glucokinase
Hypothalamic expression of the GCK gene plays an important role in the regulation of dietary glucose intake in particular, and overall feeding behavior in general. The primary hypothalamic cells expressing glucokinase are within the arcuate nucleus, ARC. Expression of the hypothalamic GCK gene increases specifically within the ARC in response to fasting. Manipulation of GCK expression within the ARC of experimental animals alters glucose intake. Increased GCK expression in the ARC results in increased glucose ingestion, whereas, decreased GCK expression results in reduced glucose ingestion. These observations indicate that ARC expression of GCK underlies the phenomenon of carbohydrate craving.
ADP-Dependent Glucokinase
In addition to the ATP-dependent glucose phosphorylating hexokinases/glucokinase, an additional glucose phosphorylating enzyme was identified in 2004. This enzyme is dependent upon ADP for activity and not ATP. This ADP-dependent glucokinase (ADP-GK) is encoded by the ADPGK gene. Expression of the ADPGK gene is seen in numerous tissues implying that it serves a housekeeping role with respect to glucose metabolism. Highest levels of expression are seen in immune cells of both myeloid and lymphoid origins.
ADP-GK is localized to the endoplasmic reticulum, ER. Like glucokinase, ADP-GK functions as a monomeric enzyme. The ADP-GK enzyme is highly specific for glucose with a Km for this substrate of around 0.09 mM. ADP-GK is inhibited by both high concentrations of glucose and by AMP. It is believed that this glucose phosphorylating enzyme is physiologically important during periods of ischemia/hypoxia and that it regulates energy metabolism via glucose sensing within the ER. One potentially important role for ADP-GK is in the regulation of ER-localized glucose-6-phosphate for the synthesis of UDP-GlcNAc that is required for O-GlcNAcylation and N-glycosylation of proteins.
The ADPGK gene is located on chromosome 15q24.1 and is composed of 10 exons that generate eight alternatively spliced mRNAs that collectively encode seven distinct protein isoforms.
Functions of HKDC1
Despite being a member of the hexokinase family of enzymes, HKDC1 does not likely participate in the normal process of glycolysis. Analysis of cancer cells demonstrates that overexpression of HKDC1 likely promotes tumorigenesis by affecting lipid metabolism more than glucose metabolism. Recent evidence has also shown that HKDC1 plays a critical role in mitochondrial and lysosomal homeostasis.
Expression of the HKDC1 gene is highest in the small intestines but is also differentially expressed in many other tissues. Elevated expression of the HKDC1 gene is found in numerous types of cancer and this is associated with poor prognosis such as is the case for hepatocellular carcinoma and squamous cell lung carcinoma (SQCLC).
Expression of the HKDC1 gene has been shown to be regulated by the transcription factor encoded by the TFEB (transcription factor EB, where the EB refers to enhancer box binding) gene. Increased TFEB expression is associated with both lysosomal and mitochondrial stress. Under these latter conditions, the TFEB-induced expression of HKDC1 results in the association of HKDC1 with the mitochondrial outer membrane protein identified as translocase of outer mitochondrial membrane 70 (commonly identified as TOM70). TOM70 is encoded by the TOMM70 gene.
Increased expression of HKDC1 is also associated with an increase in the association between mitochondria and lysosomes. These interactions involve the association of HKDC1 with the mitochondrial voltage-dependent anion-selective channels (VDAC), specifically VDAC1. The interaction of HKDC1 with VDAC1 enhances mitochondrial outer membrane contacts with lysosomal transient receptor potential cation channel mucolipin subfamily member 1 (TRPML1). The enhanced membrane contacts between mitochondria and lysosomes (and potentially endoplasmic reticulum) enhances the exchange of Ca2+, ATP, and lipids which contribute to increased lysosomal and mitochondrial homeostasis.
Expression of HKDC1 is significantly upregulated in gastric cancer and the enhanced expression is associated with poor prognosis. Within gastric cancer cells, the HKDC1 protein interacts with the protein, GTPase activating protein (SH3 domain) binding protein 1 (G3BP1) as well as with the mRNA encoding protein kinase, DNA-activated, catalytic subunit (PRKDC). The interaction of HKDC1 with G3BP1 results in enhanced stability of the HKDC1 interaction with the PRKDC mRNA, thereby stabilizing the mRNA. Increased levels of PRKDC are associated with resistance of certain cancers to chemotherapy. The observations that HKDC1 interaction with the PRKDC mRNA results in increased PRKDC suggests that targeting the activity of HKDC1 may prove useful in the treatment of certain types of cancers.
Glucose-6-phosphate Isomerase
The next reaction of glycolysis is an isomerization, in which G6P is converted to fructose 6-phosphate (F6P). The enzyme catalyzing this reaction is glucose-6-phosphate isomerase, GPI (also known as phosphohexose isomerase, PHI; or phosphoglucose isomerase, PGI). The reaction is freely reversible at normal cellular concentrations of the two hexose phosphates and thus catalyzes this interconversion during glycolytic carbon flow and during gluconeogenesis.
The GPI gene is located on chromosome 19q13.11 spanning 40 kb and composed of 20 exons that generate seven alternatively spliced mRNAs that collectively encode five protein isoforms.
6-Phosphofructo-1-Kinase (Phosphofructokinase-1, PFK-1 or PFK1)
The next reaction of glycolysis involves the utilization of a second ATP to convert F6P to fructose 1,6-bisphosphate (F1,6BP). This reaction is catalyzed by 6-phosphofructo-1-kinase, better known as phosphofructokinase-1 or PFK-1 (or PFK1). This reaction is not readily reversible because of its large positive free energy (ΔG0′ = +5.4 kcal/mol) in the reverse direction. Nevertheless, fructose units readily flow in the reverse (gluconeogenic) direction because of the ubiquitous presence of the hydrolytic enzyme of gluconeogenesis, fructose-1,6-bisphosphatase (F-1,6-BPase).
The presence of these two enzymes in the same cell compartment provides an example of a metabolic futile cycle, which if unregulated would rapidly deplete cell energy stores. However, the activity of these two enzymes is so highly regulated that PFK-1 is considered to be the rate-limiting enzyme of glycolysis and F-1,6-BPase is considered to be the rate-limiting enzyme in gluconeogenesis.
Functional PFK-1 enzymes are tetramers composed of various combinations of three different subunits encoded by three different genes. These genes encode the muscle subunit (PFKM gene), the liver subunit (PFKL gene), and the platelet subunit (PFKP gene).
The PFKM gene is located on chromosome 12q13.11 and is composed of 32 exons that generate 19 alternatively spliced mRNAs that collectively encode nine different protein isoforms.
The PFKL gene is located on chromosome 21q22.3 and is composed of 28 exons that generate two alternatively spliced mRNAs. These two PFKL mRNAs encode proteins of 830 amino acids (isoform a) and 780 amino acids (isoform b).
The PFKP gene is located on chromosome 10p15.2 and is composed of 28 exons that generate 12 alternatively spliced mRNAs that collectively encode nine protein isoforms.
The PFK-1 enzyme found in skeletal muscle is a homotetramer of the PFKM encoded proteins, whereas the liver PFK-1 enzyme is a homotetramer of the PFKL encoded protein. Erythrocytes contain multiple PFK-1 enzymes that randomly contain both the M and L proteins such that one can find M4 and L4 homotetramers as well as M3L1, M2L2, and M1L3 heterotetramers. In addition to platelets, fibroblasts also express the PFKP gene.
Aldolase A (Fructose-1,6-bisphosphate Aldolase)
Aldolase A catalyzes the hydrolysis of F1,6BP into two 3-carbon products: dihydroxyacetone phosphate (DHAP) and glyceraldehyde 3-phosphate (G3P). The aldolase A reaction proceeds readily in the reverse direction, being utilized for both glycolysis and gluconeogenesis.
The aldolase A gene (gene symbol: ALDOA) is located on chromosome 16p11.2 and is composed of 11 exons that generate four alternatively spliced mRNAs that encode two protein isoforms of 364 amino acids (isoform 1) and 418 amino acids (isoform 2).
There are three aldolase enzymes in humans, aldolase A, aldolase B, and aldolase C. The aldolase B enzyme is primarily involved in hepatic metabolism of fructose but is also expressed in the kidney and small intestine. The aldolase C enzyme is expressed primarily in the brain, specifically in the hippocampus and in Purkinje cells.
The aldolase B enzyme is encoded by the ALDOB gene which is located on chromosome 9q31.1 and is composed of 9 exons that produce a protein of 364 amino acids.
The aldolase C enzyme is encoded by the ALDOC gene which is located on chromosome 17q11.2 and is composed of 10 exons that produce a protein of 364 amino acids.
Triose Phosphate Isomerase
The two products of the aldolase A reaction equilibrate readily in a reaction catalyzed by triose phosphate isomerase (TPI). Succeeding reactions of glycolysis utilize G3P as a substrate; thus, the aldolase A reaction is pulled in the glycolytic direction by mass action principals.
The triose phosphate isomerase gene (TPI1) is located on chromosome 12p13.31 and is composed of 8 exons that generate three alternatively spliced mRNAs, each of which encode a distinct protein isoform.
Glyceraldehyde-3-Phosphate Dehydrogenase
The second phase of glucose catabolism features the energy-yielding oxidative reactions that produce ATP and NADH. In the first of these reactions, glyceraldehyde-3-phosphate dehydrogenase (GAPDH, also abbreviated GAPD) catalyzes the NAD+-dependent oxidation of G3P to 1,3-bisphosphoglycerate (1,3BPG) with the simultaneous reduction of NAD+ to NADH. The GAPDH reaction is reversible, and the same enzyme catalyzes the reverse reaction during gluconeogenesis. Functional GAPDH enzyme exists as a homotetrameric complex.
The GAPDH gene is located on chromosome 12p13.31 and is composed of 10 exons that generate five alternatively spliced mRNAs that encode three distinct protein isoforms identified as isoforms 1 (335 amino acids), 2 (293 amino acids), and 4 (317 amino acids) where isoform 1 is the predominant form encoded by three of the alternatively spliced mRNAs.
Under stress conditions GAPDH is subjected to the post-translational modification of S-nitrosylation. S-nitrosylated GAPDH translocates to the mitochondria where it is involved in the transnitrosylation of mitochondrial proteins. The mitochondrial proteins that are targets of GAPDH-mediated transnitrosylation are involved in the regulation of mitochondrial membrane permeability that includes voltage-dependent anion channel 1 (VDAC1).
Phosphoglycerate Kinase
The high-energy phosphate of 1,3-BPG is used to form ATP and 3-phosphoglycerate (3PG) by the enzyme phosphoglycerate kinase (PGK). Note that this is the only reaction of glycolysis or gluconeogenesis that involves ATP and yet is reversible under normal cell conditions. There are two PGK genes in humans identified as PGK1 and PGK2.
The PGK1 gene is located on the X chromosome (Xq21.1) and is composed of 11 exons encoding a protein of 417 amino acids. The PGK2 gene arose through a retrotranspositional event with the PGK1 gene and it is expressed only in the testis.
The PGK2 gene is an intronless gene that was generated by retrotransposition of the PGK1 gene. The PGK2 gene is located on chromosome 6p12.3 and it encodes a protein of 417 amino acids. The PGK2 encoded protein shares 87% identity to the PGK1 encoded protein.
Mutations in the PGK1 gene are inherited in an X-linked recessive manner and are associated with hemolytic anemia, myopathy, and neurologic involvement. These symptoms are highly variable in different individuals and patients may manifest one, two, or all three of these pathologies.
Phosphoglycerate Mutase
The remaining reactions of glycolysis are aimed at converting the relatively low energy phosphoacyl-ester of 3PG to a high-energy form and harvesting the phosphate as ATP. The 3PG is first converted to 2-phosphoglycerate (2PG) by phosphoglycerate mutase (PGAM) and the 2PG conversion to phosphoenolpyruvate (PEP) is catalyzed by enolase (ENO).
There are two phosphoglycerate mutase encoding genes in humans identified as PGAM1 and PGAM2. The PGAM1 gene is ubiquitously expressed, whereas, the PGAM2 encoded protein is expressed primarily in muscle tissues, predominantly the heart, and for this reason is sometimes identified as PGAM-M. The PGAM1 encoded enzyme was initially characterized from brain tissue and is, therefore, often referred to as the PGAM-B isoform.
The PGAM1 gene is located on chromosome 10q24.1 and is composed of 5 exons that generate two alternatively spliced mRNAs, both of which encode distinct protein isoforms. PGAM1 isoform 1 is 254 amino acids and isoform 2 is 239 amino acids.
The PGAM2 gene is located on chromosome 7p13 and is composed of 3 exons that encode a protein of 253 amino acids. Mutations in the PGAM2 gene are the cause of an autosomal recessive form of a glycogen storage disease (GSD10) whose pathological characteristics are similar to those of McArdle disease. Typical of McArdle disease, patients with GSD10 manifest with adolescent onset of exercise-induced cramps, occasional myoglobinuria, and intolerance for strenuous exercise. The level of phosphoglycerate mutase activity in patients with PGAM2 mutations is on the order of 5%-7% of the normal value. Muscle biopsy tissue will show increased PAS (periodic acid–Schiff) staining due to accumulation of nearly twice the normal amount of glycogen.
Biologically active PGAM enzyme is a dimeric protein that contains different proportions of subunits encoded by the PGAM1 and PGAM2 genes. The most abundant form of PGAM contains only the PGAM1 encoded protein (also identified as PGAM-BB, where the BB represents homodimeric brain isoform). The predominant form of PGAM in muscle tissues, as expected, is the PGAM-MM homodimeric isoform generated from the PGAM2 gene product. There is also a heterodimeric form of PGAM identified as PGAM-MB.
Both PGAM1 and PGAM2 encoded proteins are found in the cytosol and the nucleus. When insulin binds and activates its receptor the consequent activation of PI3K leads to accumulation of PGAM2 in the nucleus. Within the nucleus PGAM2 interacts ribosomes that functions to activate RNA synthesis.
Humans express two additional genes that are members of the PGAM gene family, neither of which encode proteins with phosphoglycerate mutase activity. The PGAM4 gene (originally identified as PGAM3) is an intronless gene located on the X chromosome (Xq21.1) within the first intron of the ATP7A gene. The PGAM4 gene appears to have arisen as a result of a retrotranspostitional event and evidence suggests that the gene encodes a potentially functional protein.
The PGAM5 gene is located on chromosome 12q24.33 and encodes a protein that was originally characterized as a mitochondrially localized Ser/Thr phosphatase. More recent studies have demonstrated that the PGAM5 encoded protein also functions as a member of the histidine phosphatase family of enzymes. Histidine phosphatases are enzymes that have a His residue in the catalytic core that becomes phosphorylated during the course of the reaction.
Enolase
As indicated in the prior section, 2-phosphoglycerate (2-PG) is converted to phosphoenolpyruvate (PEP) by enolase (ENO). Enolase also catalyzes the reverse reaction during gluconeogenesis converting PEP to 2-PG.
There are three enolase genes in humans identified as ENO1, ENO2, and ENO3 that generate the three homodimeric isoforms of functional enzyme which represent the predominant forms of enolase in humans. The proteins encoded by these three genes are referred to as α-enolase (ENO1 gene product), β-enolase (ENO3 gene product), and γ-enolase (ENO2 gene product). Functional enolase enzymes are localized to the cytosol, nucleus, and membranes.
Expression of the ENO1 gene is ubiquitous. The ENO1 enzyme is also referred to as NNE for non-neuronal enolase.
Expression of the ENO2 gene is restricted to nervous tissues. The ENO2 enzyme is also referred to as NSE for neuron-specific enolase).
Expression of the ENO3 gene predominates in muscle tissues. The ENO3 enzyme is also referred to as MSE for muscle-specific enolase. Heterodimeric forms of enolase, that contain the α-subunit and either the β-subunit (αβ) or the γ-subunit (αγ) constitute additional forms of the ENO3 enzyme.
The ENO1 gene is located on chromosome 1p36.23 and is composed of 13 exons that generate three alternatively spliced mRNAs. Two of the ENO1 generated mRNAs encode the functional 434 amino acid α-enolase protein. One of the alternatively spliced ENO1 mRNAs encodes a 341 amino acid protein identified as c-Myc promoter binding protein-1 (MBP-1). The MBP-1 protein localizes to the nucleus where it functions as a tumor suppressor by acting as a transcriptional repressor of the MYC gene.
The ENO2 gene is located on chromosome 12p13.31 and is composed of 12 exons encoding a protein of 434 amino acids.
The ENO3 gene is located on chromosome 17p13.2 and is composed of 14 exons that generate three alternatively spliced mRNAs encoding two distinct proteins of 434 amino acids (isoform 1) and 391 amino acids (isoform 2). Mutations in the ENO3 gene are associated with glycogen storage disease type 13.
Pyruvate Kinase
The final reaction of aerobic glycolysis is catalyzed by the highly regulated enzyme pyruvate kinase (PK). In this strongly exergonic reaction, the high-energy phosphate of PEP is conserved as ATP. The loss of phosphate by PEP leads to the production of pyruvate in an unstable enol form, which spontaneously tautomerizes to the more stable, keto form of pyruvate. This reaction contributes a large proportion of the free energy of hydrolysis of PEP.
There are two distinct genes encoding pyruvate kinase activity. One pyruvate kinase gene, identified as the PKLR gene, is located on chromosome 1q22 and is composed of 13 exons. The PKLR gene generates two distinct mRNAs, one of which encodes the liver (PKL or L-PK) pyruvate kinase and one that encodes the erythrocyte (PKR or R-PK) pyruvate kinase. These tissue specific PK encoding mRNAs result from the use of alternative promoters. Of the 12 exons in the PKLR gene, exons 3-12 encode identical portions of both the liver and erythrocyte mRNAs. The erythrocyte PK mRNA includes exon 1 but not exon 2. The liver PK mRNA includes exon 2 but not exon 1. Activation of the promoter used in erythroid cells is driven by both basal promoter elements and a strong erythroid specific enhancer. The PKR mRNA encodes the larger of the two PK isoforms which is a 574 amino acid protein. The PKL mRNA encoded protein is shorter at 543 amino acids. Deficiencies in expression of the PKLR gene in erythrocytes are the causes of the most common forms of inherited non-spherocytic anemia which are also the second most common causes of inherited hemolytic anemia.
The other PK gene (identified as the PKM gene) is located on chromosome 15q23 and is composed of 17 exons that generate eight alternatively spliced mRNAs. The major protein products resulting from this complex alternative splicing of the PKM precursor mRNA are identified as PKM1 (also identified as isoform b) and PKM2 (also identified as isoform a). The designation PKM reflects the fact that the enzyme was originally thought to be muscle specific in its expression. Most tissues express either the PKM1 or the PKM2 isoform. PKM1 is found in numerous normal differentiated tissues, whereas, PKM2 is highly expressed in hypoxic cells and in most proliferating cells. All cancers that have been examined for PK expression pattern show expression of the PKM2 isoform.
The state of methylation of the PKM gene is a major mechanism for the control of expression of the PKM2 isoform. Elevated expression of the PKM2 isoform has been correlated, in numerous cancers, to a hypomethylated state in intron 1 of the PKM gene. The heightened expression of PKM2 allows for a unique pathway of altered glucose oxidation and enhanced production of lactate in cancer cells and constitute what is referred to as the Warburg effect (see below).
Metabolism-Independent Glucose Signaling
Sensing of glucose levels is essential to the homeostatic regulation of overall metabolism. Indeed, dysregulation of glucose sensing is associated with numerous metabolic disorders. Overall glucose sensing represents and integrated process involving peripheral organs, such as the liver, pancreas, and kidney, the nervous system, and the flux of glucose and its metabolic substrates between these compartments.
Numerous mechanisms have been identified to sense glucose that are independent of its metabolism. The classical mechanism of glucose sensing, initially characterized in the pancreas, involves its metabolism and the generation of ATP that in turn alters the activity of the membrane-localized K+-ATP channel, leading to increased insulin secretion from β-cells.
Within the brain several metabolism-independent glucose sensing mechanisms have been identified that include adhesion G-protein coupled receptors (GPCR), the Na+-dependent glucose transporter SGLT2 that senses glucose independent of its transport function. The ability of glucose transporters to sense glucose, independent of their role in transporting glucose, represents one of several novel mechanisms of glucose sensing that do not involve the classical glucose sensing model first identified in pancreatic β-cells. Indeed, evidence has shown that both glucose-excitatory and -inhibitory neurons play important roles in the sensing of glucose in the central nervous system.
The role of glucose transporters, particularly GLUT2, in metabolism independent signaling by glucose has been demonstrated with the use of non-metabolizable glucose analogs such as 2-deoxyglucose. The signaling processes responsive to glucose activation of GLUT2 include the activation of the transcription factor ChREBP. When the GLUT2 transporter is modified in such a way that its signaling function is abolished, glucose transport and metabolism still takes place.
The SGLT2 transporter also likely plays a role in glucose sensing, independent of glucose metabolism. This effect was identified in the context of the use of SGLT2 inhibitors for the treatment of the hyperglycemia associated with type 2 diabetes. Inhibition of renal SGLT2 causes glycosuria which leads to lowering of blood glucose levels. However, the effect of SGLT2 inhibition is a compensatory increase in endogenous glucose production indicating a glucose sensing mechanism associated with SGLT2 functions. This endogenous glucose synthesis compensation results in compromised efficacy of SGLT2 inhibitors in treating hyperglycemia associated with type 2 diabetes.
G-protein coupled receptors (GPCR) of the taste receptor family have also been shown to be involved in glucose sensing, specifically the sweet taste receptor type 1 (T1R) subfamily. Heterodimers of the T1R2 and T1R3 receptors within the duodenum have been shown to bind glucose resulting in the activation of a signal transduction process between the gut and brain. Sweet taste receptors in neurons and astrocytes in the cerebellum likely also sense glucose levels in this region of the brain. Taste receptors in the hypothalamus are known to be involved in the regulation of feeding behaviors as well as overall energy homeostasis. Specifically, the T1R2-T1R3 heterodimeric receptor is involved in the activation of glucose-responsive neurons in the hypothalamus.
The G-protein associated with the T1R2-T1R3 complex is termed gustducin. When the receptor complex is activated, such as in the case of glucose binding, the βγ-subunits of gustducin dissociate and activate a signal transduction cascade initiated by phospholipase C-beta (PLCβ). This signal transduction pathway ultimately leads to the regulation of the expression of genes encoding glucose transporters.
GPCR of the adhesion receptor family, which are members of the class B GPCR superfamily, have also been shown to bind glucose resulting in activation of signaling. Specifically the adhesion receptor subfamily L receptor encoded by the ADGRL1 (adhesion G protein-coupled receptor L1) gene binds glucose and initiates a signal transduction process that is involved in the regulation of energy homeostasis as well as glucose homeostasis. These actions of glucose activated ADGRL1 are independent of glucose metabolism.
Glycolytic Enzymes Function in the Nucleus
PFKM Functions as a Histone Kinase
The major controls over the activity of PFK-1 are the allosteric regulators discussed in greater detail in the Regulation of Glycolytic Flux by PFK-1 section below. In addition to its role in glycolysis, studies have shown that the PKFM encoded isoform of PFK-1 can be localized to the nucleus where it functions as a histone kinase.
As the levels of citrate rise in the cytosol it exerts effects that enhance mitotic progression. Citrate exerts this effect through interaction with the muscle PFK-1 isoform (PFKM) inducing a shift from the glycolytically active tetrameric form to the catalytically inactive dimeric form. The citrate-mediated dimeric form of PFKM migrates to the nucleus where it functions as a histone kinase, phosphorylating histone H3 on Ser 10 (H3S10ph).
The phosphorylation of histone H3 on Ser 10 has been shown to be an important event that promotes chromatin condensation and, thereby, stimulating mitotic progression. Indeed, abnormal H3S10ph levels are associated with impaired cellular progression through mitosis. The kinase identified as Aurora B kinase (encoded by the AURKB gene) has previously been shown to be a major contributor to the phosphorylation of Ser 10 in histone H3. However, PFKM does not facilitate the phosphorylation of H3S10 by Aurora kinase B, it is capable of this phosphorylation event on its own. This effect of PFKM places it as a metabolic sensor coupling overall metabolism to cell cycle progression.
Nuclear-Localized PKM2 as a Transcriptional Co-Activator
The PKM2 isoform of pyruvate kinase is phosphorylated on serine residues at positions 37 (S37) and 202 (S202). Serine 37 phosphorylation of PKM2 stimulates its movement into the nucleus. Nuclear localized PKM2 functions as a transcriptional co-activator of β-catenin in the activation of the MYC gene. MYC is a potent transcription factor and elevated expression of MYC contributes to the transformed state of numerous types of cancer. In addition, several MYC target genes contribute to the increased metabolic profiles of cancer cells. These genes include the SLC2A1 gene that encodes glucose transporter 1 (GLUT1), the LDHA gene that encodes lactate dehydrogenase A, and also the PKM gene leading to increased levels of PKM2. This latter effect results in a positive feed-back loop between PKM2 and MYC.
Serine 202 phosphorylation also results in migration of PKM2 to the nucleus and this modification allows PKM2 to serve as a transcriptional co-activator of the transcription factors STAT3 (signal transducer and activator of transcription 3) and STAT5A (signal transducer and activator of transcription 5A). Activation of STAT5A results in enhanced transcription of a member of the cyclin family (cyclin D1) of cyclin-dependent kinase (CDK) regulators leading to enhanced cell cycle progression.
As indicated in the previous section, Lys433 (K433) in PKM2 is acetylated by p300/CBP. When acetylated PKM2 migrates to the nucleus where it can also serve as transcriptional coactivator of STAT3. In T-helper cells the PKM2-mediated activation of STAT3 promotes their differentiation and, as a result, the cell-mediated inflammatory processes of T-helper cells.
Nuclear PKM2 is also a transcriptional co-activator of the hypoxia-induced factor-1 (HIF-1) complex. The interaction of PKM2 with HIF-1 results in enhanced transcription of HIF-1 target genes, many of which encode metabolic enzymes, thereby enhancing the metabolic rate of cancer cells. Metabolic genes that are targets for HIF-1 include LDHA [encoding the M (muscle) form of lactate dehydrogenase), SLC2A1 (encoding GLUT1), PDK1 (encoding pyruvate dehydrogenase kinase 1), FASN (encoding fatty acid synthase), and ACACA (encoding acetyl-CoA carboxylase 1).
Within cancer cells, PKM2 interacts with succinylaminoimidazole carboxamide ribotide (SAICAR) which is an intermediate in purine nucleotide biosynthesis. This interaction stimulates the kinase activity of PKM2 as well as the nuclear localization of the enzyme. The activation of PKM2 by SAICAR occurs under glucose-limiting conditions and this activation promotes the survival of cancer cells under these conditions. More than 150 proteins, including numerous protein kinases, including members of the MAP kinase family, have been shown to be phosphorylated by PKM2-SAICAR complexes.
Nuclear-Localized PKM2 as RNA Binding Protein
Nuclear localization of PKM2, as discussed in the previous section, has been shown to function as a transcriptional coactivator. The localization of PKM2 to the nucleus has also been shown to be enhanced in numerous types of cancer. Recent evidence has found that in addition to transcriptional co-activation, nuclear localized PKM2 functions as an RNA-binding protein.
During the processing of heteronuclear pre-mRNA there are complex structures that form within individual RNA molecules as a result of nucleobase interactions. One such structure that forms in guanine (G)-rich regions of pre-mRNA is referred to as G-quadraplexes. These G-quadraplexes are found to form within RNA (and DNA) molecules possessing a motif identified as Gx–N1–7–Gx–N1–7–GxN1–7–Gx, where x is 3–6 guanine nucleotides and N corresponds to any nucleotide.
Nuclear-localized PKM2 has been shown to interact with G-quadraplex structures in pre-mRNAs which prevents the binding of repressive RNA binding proteins. The net effect of PKM2 binding to pre-mRNAs harboring G-quadraplexes is that there is a preferential enrichment of these mRNAs and, with respect to cancer, this enrichment contributes to the growth and proliferation of various cancer types.
Nuclear-Localized PKM2 as Histone Modifier
PKM2 contributes to the epigenetic regulation of gene expression following its translocation to the nucleus. The role of nuclear PKM2 in the regulation of gene expression involves both direct substrate phosphorylation and the generation of pyruvate. PKM2 has been shown to phosphorylate a Thr residue in histone H3 which leads to enhanced acetylation of Lys 9 of H3 (H3K9).
When acting as a kinase, PKM2 utilizes phosphoenolpyruvate (PEP) as the phosphate donor as opposed to ATP. The product of the reaction is a phosphorylated substrate, such as histone H3, and pyruvate. The nuclear-localized pyruvate can serve as a substrate for nuclear-localized pyruvate dehydrogenase (PDH) which generates acetyl-CoA. The resultant acetyl-CoA can then serve as a substrate for various acetyltransferases leading to altered patterns of histone acetylation and consequently, gene expression.
Nuclear-Localized Glyceraldehyde-3-Phosphate Dehydrogenase
In addition to the role of GAPDH in glycolysis and gluconeogenesis, the protein also functions in the nucleus. Induction of nitric oxide (NO) production, such as occurs in macrophages in response to endotoxin and in neurons in response to increases in glutamate, GAPDH is S-nitrosylated on a specific Cys residue. Following S-nitrosylation of GAPDH by the S100A8/S100A9 heterodimeric S-nitrosylase, GAPDH translocates to both the nucleus and the mitochondria, locations where it functions in the regulation of transcription and the regulation of apoptosis, respectively.
The S-nitrosylation of GAPDH enables it to interact with the E3 ubiquitin ligase SIAH1. SIAH1 possesses a nuclear localization signal which allows GAPDH to be co-translocated into the nucleus. In the nucleus GAPDH transnitrosylates proteins that are involved in transcriptional regulation and also in DNA repair such as SIRT1 and DNA-activating protein kinase (DNA-PK). The GAPDH-mediated transnitrosylation of SIRT1 leads to enhanced acetylation of the transcriptional co-regulator, PGC-1α, the consequences of which are reduced co-activation of other transcription factors such as HNF-4α.
Nuclear GAPDH has also been shown to interact with the p300/CBP acetyltransferases. The interaction of nuclear GAPDH with p300/CBP results in enhanced acetyltransferase activity which then acetylates several proteins included the p53 tumor suppressor. The consequences of GAPDH-mediated enhancement of p300/CBP acetylation of p53 is apoptosis.
Nuclear-localized GAPDH is also involved in the processes of DNA damage repair and homologous recombination. Cytosolic GAPDH can be phosphorylated by the SRC tyrosine kinase which stimulates its migration into the nucleus where it has been shown to directly interact with, and activate, the DNA polymerase (DNA polβ) involved in the process of base excision repair (BER). Nuclear GAPDH also enhances the activity of the APEX1 (apurinic/apyrimidinic endodeoxyribonuclease 1) encoded enzyme (also referred to as AP site endonuclease 1, APE1) to promote the repair of damaged DNA. Another nuclear enzyme to which GAPDH interacts is polyADP-ribose polymerase 1 (PARP1) which is involved in the recruitment of the histone deacetylase, SIRT7, to sites of DNA damage.
In the context of homologous recombination, nuclear GAPDH is involved in the stabilization of the RAD51 protein. RAD51 is the central catalyst for the process of homologous recombination during which it forms a filament on single-stranded regions of DNA facilitating the recognition of homologous sequences during the repair of double-strand breaks in DNA occurring during replication. The GAPDH-mediated stabilization of RAD51 involves the direct interaction of GAPDH with the histone deacetylase, HDAC1, a member of the class I family of HDAC genes. Activation of HDAC1 by GAPDH results in the deacetylation of RAD51 which is required for its stabilization.
Nuclear-localized GAPDH also participates in the regulation of the nuclear pool of NAD+ by promoting the activity of the NAD+ salvage enzyme, nicotinamide phosphoribosyltransferase (NAMPT). The normal subcellular localization of NAMPT is in the cytosol. However, interaction of NAMPT with GAPDH promotes the nuclear migration of NAMPT. Within the nucleus, NAMPT can generate nuclear nicotinamide mononucleotide (NMN) which is then used to replenish nuclear NAD+ pools.
Erythrocyte 2,3-Bisphosphoglycerate
Associated with the phosphoglycerate kinase pathway is an important reaction of erythrocytes, the formation of 2,3-bisphosphoglycerate, 2,3BPG (see Figure below). The pathway of red blood cell 2,3BPG synthesis is referred to as the Rapoport–Luebering shunt. The function of 2,3BPG is to serve as an important regulator of the affinity of hemoglobin for oxygen.
The synthesis of 2,3BPG, as well as its degradation to 3-phosphoglycerate, is catalyzed by the bi-functional enzyme 2,3-bisphosphoglycerate mutase (BPGM). The two activities of BPGM are 2,3-bisphosphoglycerate synthase, and 2,3-bisphosphoglycerate phosphatase. The synthase activity of the enzyme is most active at alkaline pH, whereas, the phosphatase activity is more active at acidic pH. BPGM is structurally related to the phosphoglycerate mutase (PGAM) isozymes described in the next section but is encoded by a distinct gene. The BPGM gene is located on chromosome 7q33 and is composed of 6 exons that generate three alternatively spliced mRNAs, each of which encode the same 259 amino acid protein.
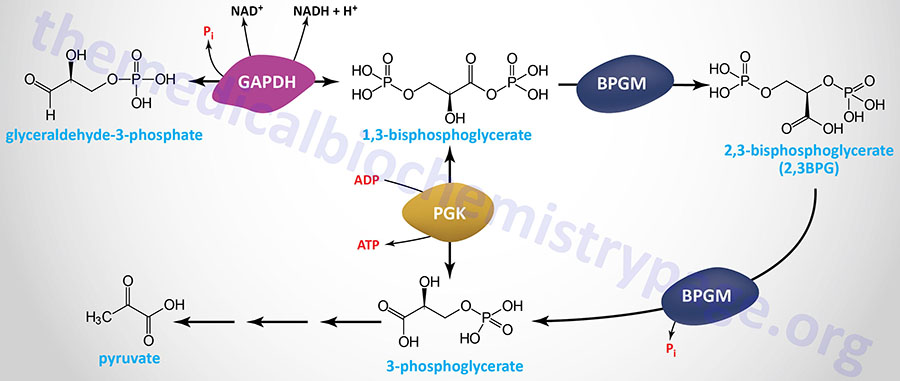
Although the hydrolysis of 2,3-BPG was thought to be exclusively catalyzed by the phosphatase activity of BPGM, evidence has shown that the phosphoinositide phosphatase encoded by the MINPP1 (multiple inositol-polyphosphate phosphatase 1) gene is also capable of 2,3-BPG hydrolysis. In the case of MINPP1 action on 2,3-BPG the product is 2-phosphoglycerate.
The major mechanism for the control of erythrocyte 2,3BPG synthesis is the switch from normoxia to hypoxia. Under normoxic conditions approximately 75% of erythrocyte glucose is shunted to the pentose phosphate pathway for the production of NADPH in order to efficiently couple this with the anti-oxidant glutathione (GSH) cycle, thereby limiting the amount of reactive oxygen species (ROS) in the erythrocyte. However, under hypoxic condition erythrocyte glucose metabolism is switched toward the Rapoport–Luebering shunt. This shift allows for greater ATP production as well as more 2,3BPG synthesis which promotes greater levels of oxygen release to the tissues thereby countering the hypoxia.
Regulation of 2,3BPG Synthesis and High Altitude Acclimation
It has been known for more than 50 years that 2,3-BPG levels increase in the erythrocytes of normal individuals who have acclimated to life at high altitudes (hypoxic conditions). The precise molecular basis for this phenomenon has only recently been fully appreciated.
Contributing to erythrocyte metabolic reprogramming at high altitude, as well as under other hypoxic conditions, is an increase in plasma levels of adenosine. Associated with increasing adenosine concentration is increased erythrocyte synthesis of the potent bioactive lipid, sphingosine-1-phosphate (S1P). Both of these processes function in concert to reprogram metabolism in erythrocytes resulting in increased 2,3BPG synthesis.
At high altitude, as well as under other hypoxic conditions, increased levels of soluble 5′-nucleotidase, ecto (encoded by the NT5E gene), a normally membrane-associated enzyme, result in increased conversion of extracellular AMP to adenosine. Adenosine exerts effects, such as in neurotransmission, by binding to specific receptors. The adenosine receptor on erythrocytes, A2B, is encoded by the ADORA2B gene. One of the responses to activation of A2B is increased PKA activity. One of the substrates of PKA is sphingosine kinase 1 (encoded by the SPHK1 gene ) which leads to its activation and a resulting increase in S1P production. Combined with the actions of S1P and the activation of the A2B receptor is increased 2,3BPG synthesis.
The most abundant membrane protein in erythrocytes was originally identified as band 3, now known as anion exchanger 1 (AE1) which is encoded by the SLC4A1 gene. The intracellular N-terminal domain of AE1 binds to several glycolytic enzymes including PFK-1, aldolase A, and glyceraldehyde-3-phosphate dehydrogenase. One of the consequences of increased erythrocyte S1P is the release of these glycolytic enzymes from AE1 resulting in an increase in glycolysis and subsequently, increased 2,3BPG synthesis. In addition to activation of PKA, A2B activates AMPK which directly phosphorylates BPGM further enhancing synthesis of 2,3BPG.
Anaerobic Glycolysis: Glucose to Lactate
It has been the dogma that under aerobic conditions glucose is oxidized to pyruvate and then, in most cells, the pyruvate is further metabolized via the TCA cycle to CO2 and H2O. However, recently studies have shown that glucose oxidation proceeds to lactate under fully aerobic conditions such that under normal physiological conditions the lactate to pyruvate ratio is approximately 10 in both arterial blood and skeletal muscle cells. Under aerobic conditions lactate metabolism occurs in the mitochondria through a process referred to as the lactate shuttle.
Under anaerobic conditions, particularly in erythrocytes (due to their lack of mitochondria), pyruvate is rapidly converted to lactate by the enzyme lactate dehydrogenase (LDH), and the lactate is transported out of the cell into the circulation. Another cell type that carries out glycolysis to lactate at a nearly 100% rate is vascular endothelial cells (ECs). The relatively low level of mitochondria in ECs accounts for this level of glycolysis to lactate and also offers the advantage of reduced reactive oxygen species (ROS) generation.
The conversion of pyruvate to lactate, under anaerobic conditions, provides the cell with a mechanism for the oxidation of NADH (produced during the GAPDH reaction) to NAD+ which occurs during the LDH catalyzed reaction. This reduction is required since NAD+ is a necessary substrate for GAPDH, without which glycolysis will cease. Normally, during aerobic glycolysis the electrons of cytoplasmic NADH are transferred to mitochondrial carriers of the oxidative phosphorylation pathway generating a continuous pool of cytoplasmic NAD+.
Aerobic glycolysis generates substantially more ATP per mole of glucose oxidized than does anaerobic glycolysis. The utility of anaerobic glycolysis, to a muscle cell when it needs large amounts of energy, stems from the fact that the rate of ATP production from glycolysis is approximately 100X faster than from oxidative phosphorylation. During exertion muscle cells do not need to energize anabolic reaction pathways. The requirement is to generate the maximum amount of ATP, for muscle contraction, in the shortest time frame.
Metabolic Fates of Pyruvate
Pyruvate is the branch point molecule of glycolysis. The ultimate fate of pyruvate depends on the oxidation state of the cell. In the reaction catalyzed by GAPDH a molecule of NAD+ is reduced to NADH. In order to maintain the redox state of the cell, this NADH must be re-oxidized to NAD+. During aerobic glycolysis this occurs in the mitochondrial electron transport chain generating ATP. Thus, during aerobic glycolysis ATP is generated from oxidation of glucose directly at the PGK and PK reactions as well as indirectly by re-oxidation of NADH in the oxidative phosphorylation pathway. Additional NADH molecules are generated during the complete aerobic oxidation of the acetyl-CoA derived from pyruvate in the TCA cycle. Pyruvate enters the TCA cycle in the form of acetyl-CoA which is the product of the pyruvate dehydrogenase reaction. The fate of pyruvate during anaerobic glycolysis is reduction to lactate.
Lactate Metabolism
During anaerobic glycolysis, that period of time when glycolysis is proceeding at a high rate (or in anaerobic tissues such as red blood cells), the oxidation of NADH occurs through the reduction of an organic substrate. Erythrocytes and skeletal muscle (under conditions of exertion) derive all of their ATP needs through anaerobic glycolysis. The large quantity of NADH produced can be oxidized by reducing pyruvate to lactate. This reaction is carried out by lactate dehydrogenase, (LDH).
The lactate is transported from cells, to the blood, via the action of transporters of the monocarboxylate transporter (MCT) family as described in the Functions of Intracellular and Extracellular Lactate section. The lactate is then transported in the blood to highly aerobic tissues such as the brain, cardiac muscle, skeletal muscle, and liver where it is taken up into cells of the tissue by the same family of monocarboxylate transporters. The lactate is then oxidized to pyruvate in these cells by LDH and the pyruvate is further oxidized by the pyruvate dehydrogenase complex (PDHc) within the mitochondria. The resulting acetyl-CoA is then fully oxidized in the TCA cycle. If the energy level in the liver is high, the carbons of pyruvate will be diverted back to glucose via the gluconeogenesis pathway.
There are two distinct forms of LDH determined by their specificity toward L-lactate and/or D-lactate. These enzymes are encoded for by four different genes in humans identified as LDHA, LDHB, LDHC, and LDHD. Only the LDHD encoded enzyme shows specificity for D-lactate.
Although expressed in numerous tissues, the LDHA gene encodes what is referred to as the muscle-specific (M) subunit of LDH. The LDHB gene is also expressed in numerous tissues and encodes what is referred to as the heart-specific (H) subunit of LDH. As indicated below, different combinations of the M and H subunits generate LDH isoforms in different tissues. The protein encoded by the LDHC gene is found only in the testis. The enzyme encoded by the LDHD gene is a mitochondria localized enzyme specific for D-lactate and whose expression appears to rise in certain types of cancer (e.g. prostate cancers).
The LDHA gene is located on chromosome 11p15.1 and is composed of 9 exons that generate multiple alternatively spliced mRNAs. Mutations in the LDHA gene are associated with the glycogen storage disease type 11, GSD11.
The LDHB gene is located on chromosome 12p12.1 and is composed of 8 exons that generate two alternatively spliced mRNAs that both encode the same 334 amino acid protein. In addition to the 334 amino acid protein, one of the alternatively spliced LDHB mRNAs encodes a distinct 341 amino acid protein identified as LDHBx. The LDHBx protein results from translational read-through of the normal UGA stop codon with termination occurring at a downstream UAG codon. Analysis of the LDHBx protein demonstrates that several different amino acids (Arg, Cys, Ser, or Trp) can be found at the position of the UGA codon. The LDHBx protein localizes to the peroxisomes. Read-through of a UGA stop codon, resulting in a peroxisome-localized isoform, is also found with expression of the MDH1 gene as described above.
The LDHC gene is located on chromosome 11p15.1 and is composed of 8 exons that generate two alternatively spliced mRNAs that both encode the same 332 amino acid protein.
The LDHD gene is located on chromosome 16q23.1 and is composed of 11 exons that generate two alternatively spliced mRNAs encoding two isoforms of this enzyme.
The majority of the functional LDH in mammalian cells contain various combinations two distinct types of LDH subunits, termed M (encoded by the LDHA gene) and H (encoded by the LDHB gene). Combinations of these different subunits generate LDH isozymes with different characteristics.
The H type subunit predominates in aerobic tissues such as heart muscle (as the H4 tetramer) while the M subunit predominates in anaerobic tissues such as skeletal muscle (as the M4 tetramer). The various other isoforms of LDH are described in the Enzyme Kinetics and Diagnostic Uses of Enzymes page.
H4 LDH has a low Km for pyruvate and also is inhibited by high levels of pyruvate. The M4 LDH enzyme has a high Km for pyruvate and is not inhibited by pyruvate. Due to the different Km and regulation characteristics the LDHA encoded form of LDH is predominantly involved in the reduction of pyruvate to lactate while the LDHB encoded form of LDH is utilized for oxidizing lactate to pyruvate.
Functions of Intracellular and Extracellular Lactate
The lactate does not simple serve as an intracellular carbon source for hepatic glucose production via gluconeogenesis. Lactate is utilized as an energy source by the brain, cardiac muscle, and skeletal muscle in particular. In addition to its role in glucose homeostasis and energy production, lactate functions as a signaling molecule with actions of autocrine, paracrine, and endocrine hormones. These latter functions of lactate have led to the molecule being referred to as a lactormone.
Lactate is transported out of cells via transporters of the monocarboxylate transporter (MCT) family which are encoded by genes of the SLC16 family. Humans express several genes encoding transporters of the MCT family with four being involved in the influx and efflux of lactate. The MCT family lactate transporters are symporters they transport lactic acid and protons (H+) simultaneously. The MCT family of lactate transporters function bidirectionally allowing cells to switch between lactate release and lactate uptake depending on changes in lactate concentration as well as pH.
Mitochondrial Lactate Metabolism: The Lactate Shuttle
Lactate, regardless of where it is generated, can be taken up by numerous other tissues where it can be metabolized. The use of lactate for energy has been proposed to occur within the mitochondria where it can be oxidized to pyruvate by mitochondrial LDH which localizes to the inner mitochondrial membrane. Under conditions of normal metabolism, mitochondrial LDH slowly reduces pyruvate to lactate which allows for electrons in NADH to be transferred to pyruvate, forming lactate. This process removes electrons from the matrix, and possibly from the cell via lactate efflux to the blood. Under conditions of hypoxia, the low levels of oxygen lead to accumulation of NADH and under these conditions mitochondria can increase the oxidation of NADH via the LDH-mediated reduction of pyruvate.
The SLC16A1 gene, that encodes MCT1, is expressed in multiple tissues. MCT1 is responsible for both influx and efflux of lactate as well as for transport of lactate into the mitochondria and the peroxisomes. When present in the inner mitochondrial membrane, MCT1 colocalizes with the chaperone protein identified as CD147 which is encoded by the BSG [basigin (Ok blood group)] gene. CD147 is also called EMMPRIN (extracellular matrix metalloproteinase inducer).
The SLC16A7 gene, that encodes MCT2, is expressed primarily in skeletal muscle, brain, and blood. MCT2 is responsible for efflux of lactate. MCT2 is also responsible for transport of lactate into the peroxisomes.
The SLC16A8 gene, that encodes MCT3, is expressed predominantly in the retina and epithelial cells of the eye. MCT3 is responsible for efflux of lactate.
The SLC16A3 gene, that encodes MCT4, is expressed primarily in the intestines, kidney, skeletal muscle, heart, and lungs. MCT4 is responsible for efflux of lactate.
Metabolism of lactate has been proposed to support mitochondrial respiration even in the absence of mitochondrial import of cytoplasmic pyruvate. Lactate was originally thought to be transported into mitochondria primarily via the actions of the MCT1 transporter. However, recent studies (2026) have shown that the mitochondrial pyruvate carrier (MPC) complex is involved in the mitochondrial export of lactate. The MPC is a heterotetrameric complex composed of subunits encoded by the MPC1 and MPC2 genes. The MPC transporter proteins are members of the large superfamily of solute carrier (SLC) proteins and as such MPC1 is also identified as SLC54A1 and MPC2 is also identified as SLC54A2.
Within the mitochondria, lactate can be oxidized to pyruvate by a complex referred to as the mitochondrial lactate oxidation complex, mLOC. The mLOC is composed of the monocarboxylate transporters, MCT1 and MCT4 (and possibly MCT2), the lactate dehydrogenase isoforms, LDHA and LDHB, cytochrome oxidase (complex IV of oxidative phosphorylation), and a scaffolding chaperone basignin (previously identified as CD147). The presence, and the function, of the mLOC reflects what is referred to as the lactate shuttle, a process whereby the generation and metabolism of lactate is not restricted to the dogmatic paradigm of anaerobic glycolysis.
Extracellular Lactate: Lactormone
Extracellular lactate is the ligand for the GPCR identified as hydroxycarboxylic acid receptor 1 (HCA1) which is encoded by the HCAR1 gene. This receptor was originally identified as an orphan GPCR and named GPR81. As the name implies, HCA1 is a member of the hydroxycarboxylic acid (HCA) receptor family. HCA1 is expressed at high levels on adipocytes where binding of lactate results in reduced release of fatty acids from stored triglycerides. The HCA1 receptor is also found on cancer cells and dendritic cells of the immune system. These sites of expression contribute to the role of lactate in overall cancer metabolism and immune system evasion. Due to the altered metabolism of glucose in cancer cells they produce large amounts of lactate.
Lactate has also been shown to bind to the GPCR identified as GPR132 and this receptor is involved in the role of lactate in modulating immune responses. GPR132, which is also identified as G2A (G2 accumulation), was originally identified as a proton sensing receptor. GPR132 is a member of the class A orphan receptor family of GPCR. GPR132 is coupled to a Gq-type G-protein that leads to the activation of PLCβ which when active hydrolyzes membrane localized phosphatidylinositol-4,5-bisphosphate (PIP2; PtdIns-4,5-P2) generating inositol-1,4,5-trisphosphate (IP3; Ins-1,4,5-P3). The resulting IP3 binds to receptors in the endoplasmic reticulum (ER) resulting in release of stored Ca2+. GPR132 has also been shown to be associated with a Gs-type G-protein that activates adenylate cyclase leading to increased production of cAMP with subsequent activation of PKA.
Lactate has also been shown to bind to a GPCR that is a member of the olfactory receptor subfamily of the class A GPCR family. This receptor was originally identified as Olfr78 but is now identified as olfactory receptor family 51 subfamily E member 2 (OR51E2). The OR51E2 gene is highly expressed in the prostate and in the oxygen-sensitive glomus cells of the carotid body, a chemosensory organ at the bifurcation of the carotid artery. The carotid body monitors blood oxygen and stimulates breathing within seconds when oxygen declines. Lactate accumulates under hypoxic conditions and induces hyperventilation by binding to and activating OR51E2 within the carotid body.
Extracellular lactate also serves as the major carbon source feeding the tricarboxylic acid (TCA) cycle within multiple different tissues, indeed in all tissues except the brain. Lactate, originating from anaerobic glycolysis, predominantly occurring in red blood cells and skeletal muscle, is transported via the blood to other tissues and transported into cells via transporters of the MCT family. Upon uptake, the lactate can be oxidized to pyruvate via the action of lactate dehydrogenase. The pyruvate is then oxidized by the pyruvate dehydrogenase complex (PDHc) and the resulting acetyl-CoA can enter the TCA cycle.
Lactate, as lactoyl-CoA, is also an enzymatic and non-enzymatic modifier of lysine residues in histone proteins and many other proteins including enzymes of glycolysis. This lysine modification is referred to as lactylation (Klac; also referred to as lactoylation).
It has been observed for many years that there is a correlation between increased lactate production rates and cell proliferation, particularly in cancer cells. Recent evidence has found that the E2 ubiquitin-conjugating enzyme (UBE2C), that is a transient partner of the anaphase-promoting complex/cyclosome (APC/C), directly interacts with lactate and that this interaction results in altered cell cycle progression. When lactate levels rise there is increased interaction between UBE2C and APC/C via a stimulation of the SUMOylation of APC4. APC4 is a component of the APC/C and functions as a cell cycle-regulated E3 ubiquitin ligase that controls progression through mitosis and the G1 phase of the cell cycle.
The mechanism by which lactate alters the SUMOylation of APC4, as well as other cell cycle regulatory components, is by forming a complex with Zn2+ in the active site of the SUMO protease, SENP1. The interaction of lactate with SENP1 results in the inhibition of the deSUMOylation of proteins such as APC4. This in turn promotes APC/C interaction with UBE2C which then ubiquitylates several cell cycle regulatory proteins such as cyclin B1 and securin. The net effect is progression of the cell cycle to mitosis and cell division. When lactate levels are low the reverse is true, SENP1 deSUMOylates APC4 which prevents APC/C and UBE2C interaction causing cells to remain at the G2-M transition.
As described in the Iron and Copper Homeostasis page, lactate is also involved in the regulation of iron homeostasis via actions within hepatocytes of the liver. Within hepatocytes lactate binds to soluble adenylate cyclase (sAC) thereby activating a signaling cascade resulting in increased expression of the HAMP gene that encodes hepcidin. Hepcidin is released from hepatocytes and interacts with the iron transporter, ferroportin, on intestinal enterocytes resulting in the internalization of the transporter. This results in reduced release of dietary iron from enterocytes into the circulation.
Role of Lactate in Insulin Secretion
Within pancreatic β-cells, expression of both the LDHA and LDHB genes occurs but the level of LDHB gene expression is significantly higher than that of the LDHA gene. Expression of the LDHA gene is much higher in α-cells of the pancreas compared to β-cells.
Since the LDH isoform derived from the LDHA gene is primarily responsible for the reduction of pyruvate to lactate, the low level expression of LDHA in β-cells ensures that the majority of the pyruvate derived from glucose oxidation enters the TCA cycle via the actions of the PDHc. Conversely, since the LDH isoform derived from the LDHB gene is primarily responsible for the oxidation of lactate to pyruvate the high level of LDHB expression in β-cells ensures that the bulk of lactate generated from pyruvate via the actions of LDHA derived LDH is rapidly oxidized back to pyruvate.
The LDHB-mediated maintenance of low lactate levels in pancreatic β-cells has been shown to be a critical component of the regulation of insulin secretion. The effects of lactate in β-cells is exerted at the level of intracellular Ca2+ as opposed to affecting the ATP/ADP ratio. When LDHB activity is impaired or inhibited there is an associated increase in insulin secretion, particularly in the fasted state.
Lactate in Appetite Suppression
The role of lactate in the suppression of appetite is exerted through the generation of the the pseudopeptide identified as Lac-Phe. Although produced by a variety of epithelial and immune cells, the major site of Lac-Phe synthesis is intestinal epithelial cells. The biosynthesis of Lac-Phe from lactate and phenylalanine is catalyzed by the non-specific peptidase, carnosine dipeptidase 2 (encoded by the CNDP2 gene).
Lac-Phe is a blood-borne signaling metabolite that suppresses feeding and obesity. As detailed in the Secreted Factors: Tissue “Kines” page, skeletal muscle cells secrete numerous metabolites during and following exercise, not all of which exert inhibitory effects on feeding behaviors. Lac-Phe represents the third highest exercise-induced metabolite secreted from exercising muscle. Other pseudodipeptides, such as Lac-Ile, Lac-Leu, and Lac-Val, have been shown to be equally increased in the blood after exercise but whether they contribute to changes in feeding behavior have, as yet, not been determined.
Although Lac-Phe was originally identified as an appetite suppressing exerkine produced in response to increased exercise, recent (2024) data has determined that production of La-Phe by intestinal epithelial cells represents the major site of production. Production of Lac-Phe by intestinal epithelial cells increases in response to the administration of the type 2 diabetes drug, metformin. Indeed, the suppression of appetite and the weight loss associated with metformin is primarily due to the induction of Lac-Phe synthesis.
Regulation of Glycolysis
The reactions catalyzed by hexokinase (or glucokinase), PFK-1, and PK all proceed with a relatively large free energy decrease. These non-reversible reactions of glycolysis would be ideal candidates for regulation of the flux through glycolysis. Indeed, in vitro studies have shown all three enzymes to be allosterically controlled.
Metabolomic and proteomic studies have demonstrated that in non-hepatic cells the major controls on the rate of glycolysis are exerted via the hexokinase reaction and the PFK-1 reaction. In some, but not all, cells regulation of glycolysis is also exerted through the regulation of glucose influx into the cell and lactate efflux out of the cell.
Whereas these are the critically regulated steps of glycolysis, evidence does indicate that regulation of the activity of pyruvate kinase will modify glycolytic flux. However, regulation of PK it is not a dominant contributor when compared to the other four highly regulated steps.
Regulation of Glycolysis through Glucose Influx
Increased expression of the genes encoding GLUT1 (SLC2A1 gene), GLUT3 (SLC2A3 gene), and GLUT5 (SLC2A5 gene) has been shown to lead to increased rates of glycolysis. Of significance is that fact that in numerous human cancers, which have enhanced metabolic profiles and altered glycolysis, the level of expression of GLUT1 and GLUT5 is increased.
Regulation of Hepatic Glycolytic Flux by Glucokinase
A major level of control over hepatic glucokinase activity is exerted by the protein identified as glucokinase regulatory protein (GKRP) encoded by the GCKR (glucokinase regulator) gene. The GCKR gene is located on chromosome 2p23.3 and is composed of 20 exons that encode a protein of 625 amino acids. Expression of the GCKR gene is exclusively hepatic. During the fasting state, glucokinase is “held” in the nucleus by interaction with GKRP. This localization prevents glucokinase access to cytosolic glucose until it is released from GKRP. At sufficient intracellular levels of glucose, glucokinase is released from GKRP and can begin to phosphorylate cytosolic glucose.
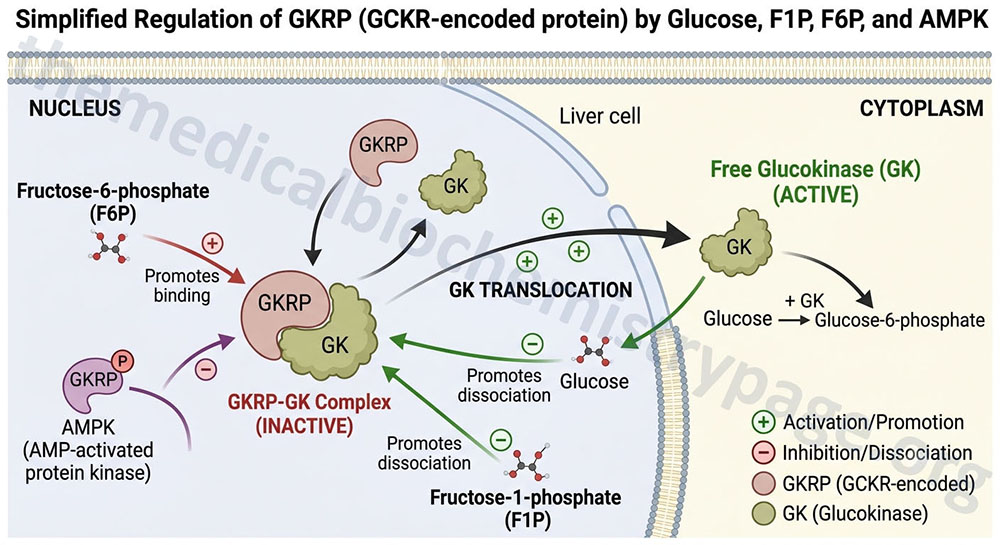
In addition to glucose, fructose-1-phosphate (F1P), derived from the action of hepatic fructokinase phosphorylating fructose, stimulates the release of glucokinase from GKRP. Indeed, the ability of F1P to stimulate the release of glucokinase from GKRP ultimately contributes to the potentially lethal hypoglycemia associated with the fructose metabolic disorder, hereditary fructose intolerance. This latter effect results from inappropriate release of glucokinase to the cytosol leading to the phosphorylation of glucose, thereby, trapping the glucose within hepatocytes.
The activity of GKRP is also regulated by binding of fructose-6-phosphate (F6P) as well as by phosphorylation. The binding of F6P to GKRP enhances the binding of GKRP to glucokinase. This essentially prevents the generation of more glucose-6-phosphate under conditions that would be associated with rising levels of F6P such as adequate glycogen stores and adequate ATP levels within hepatocytes.
The phosphorylation of GKRP occurs through the action of AMPK which results in the release of glucokinase from GKRP. The activity of AMPK rises as the energy charge falls (increasing AMP levels), therefore, it would make sense for the hepatocyte to increase energy production via glycolysis which would be enhanced by increased glucokinase activity.
Regulation of Glycolytic Flux by PFK-1 (PFK1)
PFK-1 is a tetrameric enzyme that exists in two conformational states termed R and T that are in equilibrium. ATP is both a substrate and an allosteric inhibitor of PFK-1. Each subunit has two ATP binding sites, a substrate site and an allosteric inhibitor site. The substrate site binds ATP equally well when the tetramer is in either conformation. The allosteric inhibitor site binds ATP essentially only when the enzyme is in the T state.
F6P is the other substrate for PFK-1 and it also binds preferentially to the R state enzyme. At high concentrations of ATP, the inhibitor site becomes occupied shifting the equilibrium of PFK-1 conformation to that of the T state decreasing the ability of PFK-1 to bind F6P.
The inhibition of PFK-1 by ATP is overcome by AMP which binds to the R state of the enzyme and, therefore, stabilizes the conformation of the enzyme capable of binding F6P. The most important allosteric regulator of both glycolysis and gluconeogenesis is fructose 2,6-bisphosphate (F2,6BP) which is not an intermediate in glycolysis or in gluconeogenesis.
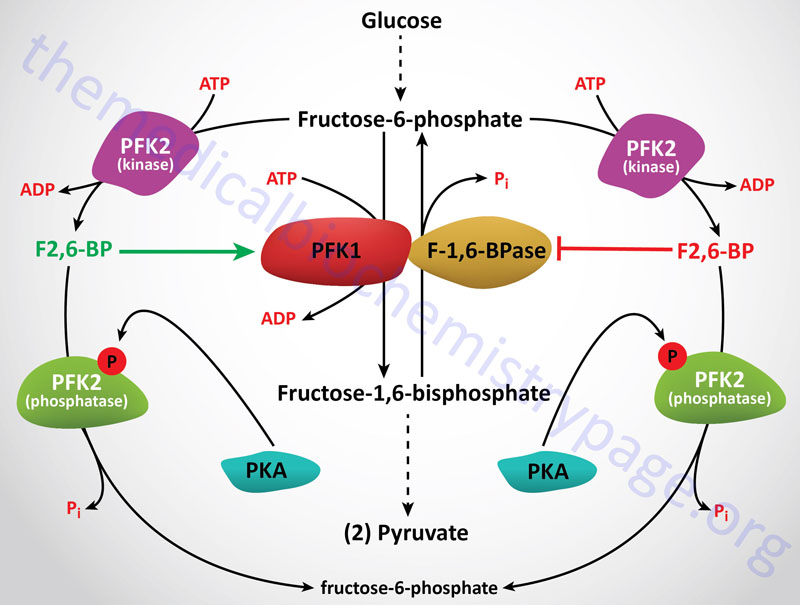
The activity of PFK-1 is also regulated by reversible glycosylation, specifically O-GlcNAcylation. In response to hypoxia, a serine (Ser529) in PFK-1 is O-GlcNAcylated and this results in inhibition of the enzyme. This phenomenon confers a growth advantage to certain cancer cells because glucose is diverted into the pentose phosphate pathway allowing the carbon atoms to be utilized for biomass production. The pathological significance of this mode of PFK-1 regulation is that the targeting of the enzyme for inhibition of the O-GlcNAcylation has been shown to inhibit cancer growth and impairs tumor formation.
The regulation, and activity, of PFK-1 in the liver is also controlled by its state of phosphorylation. The version of PFK-1 encoded by the PFKL gene undergoes phosphorylation during periods of glucose deprivation. When phosphorylated, the PFKL encoded enzyme interacts with the lipid droplet associated protein, perilipin-2 (PLIN2). The interaction of the PFKL encoded enzyme and perilipin-2 leads to this version of PFK-1 functioning as a protein kinase where it phosphorylates perilipin-2. The phosphorylation of perilipin-2 promotes the interaction of perilipin-2 with carnitine palmitoyltransferase 1A (CPT1A) and the recruitment of adipose tissue triglyceride lipase (ATGL). The consequence of these interactions is the tethering of lipid droplets to the outer mitochondrial membrane. The tethering of lipid droplets to the mitochondria enhances energy generation through the increased availability of fatty acids for mitochondrial β-oxidation.
Regulation of Glycolytic Flux by PFK-2
The synthesis of F2,6BP is catalyzed by the bifunctional enzyme phosphofructokinase-2/fructose-2,6-bisphosphatase (PFK-2/F-2,6-BPase, or commonly just PFK-2). PFK-2 in mammalian organisms is a homodimer. The PFK-2 kinase domain is related to the catalytic domain of adenylate kinase. The F-2,6-BPase domain of the enzyme is structurally and functionally related to the histidine phosphatase family of enzymes.
In the context of the active enzyme homodimer, the PFK-2 domains function together in a head-to-head orientation, whereas the F-2,6-BPase domains can function as monomers. The PFK-2 reaction is catalyzed in the N-terminal half of the enzyme subunit, whereas the FBPase-2 reaction is catalyzed in the C-terminal half.
There are four PFK-2 encoding genes in humans. Each PFK-2 gene also encodes several different isoforms via alternative splicing. The four different PFK-2 genes are generally defined by the predominant tissue of expression, the liver, heart, brain (or placenta), and testis. Each PFK-2 isoform differs by the sequences of their bifunctional catalytic cores and their N-terminal amino acid sequences. The four different PFK-2 encoding genes are identified as PFKFB1, PFKFB2, PFKFB3, and PFKFB4. The PFKFB1 and PFKFB2 genes are the most highly characterized of the four genes. The regulatory sequences present in these four genes that are responsible for their long-term control by hormones and tissue specific transcription factors have been identified.
PFKFB1
The PFKFB1 gene encodes what is identified as the liver isoform. The PFKFB1 gene is located on the X chromosome (Xp11.21) and is composed of 17 exons. The PFKFB1 gene encodes three different mRNAs as a result of alternative splicing and alternative promoter usage. These mRNAs, and their promoters, are called L, M and F. The three mRNAs differ in their 5′ ends but share 12 common exons (exons 2-13), six of which encode the PFK-2 catalytic domain and six of which encode the F-2,6-BPase catalytic domain. The L-type exon 1 is found the the L mRNA and the M-type exon 1 is found in the M mRNA. There are two F-type mRNAs that are derived by the splicing of two non-coding exons to part of the M-type exon 1. The L-type exon 1 sequences included in the L type enzyme contain a serine residue (Ser32) that is the target of PKA-mediated phosphorylation (see below). The L mRNA is expressed in liver and white adipose tissue, the M mRNA is expressed in skeletal muscle and white adipose tissue, and the F mRNA is expressed in fibroblasts, proliferating cells, and fetal tissues.
PFKFB2
The PFKFB2 gene encodes what is identified as the heart isoform. The PFKFB2 gene is located on chromosome 1q32.1 and is composed of 22 exons that encode two mRNAs as a result of alternative promoter usage. Exons 3-14 are very similar to those of the PFKFB1 gene that code for the core catalytic domain. Exon 15 contains several phosphorylation sites. How the distinct 5′ ends relate to the three mRNAs (H1, H2 and H4) that give rise to the 58 kDa isoform and the mRNA (H3) that encodes the 54 kDa isoform, is as yet unknown. Although initially referred to as the heart isoform, the PFKFB2 gene is expressed in almost all tissues.
PFKFB3
The PFKFB3 gene encodes what is identified as the brain/placenta isoform. The PFKFB3 gene is located on chromosome 10p15.1 and is composed of 21 exons that generate seven alternatively spliced mRNAs, each of which encodes a unique protein isoform.
Alternative splicing of exon 15 and possibly differential promoter usage yields two main isoforms that differ by a short C-terminal sequence. These two different PFKFB3 isoforms are referred to as the ubiquitous isoform (uPFK-2; also called the constitutive form) and the inducible isoform (iPFK-2). The inducible isoform is expressed at very low levels in adult tissues but its expression is induced in tumor cell lines and by pro-inflammatory stimuli. The uPFK-2 isoform has the highest kinase to bisphosphatase activity ratio indicating this version of PFK-2 favors the glycolytic direction.
Although originally identified as the brain isoform, the PFKFB3 gene is expressed at the highest levels in adipose tissue and is also expressed at high levels in the kidney and bone marrow. Expression of PFKFB3 in vascular endothelial cells (ECs) represents a critical regulator of EC glycolysis.
Of potential clinical significance is the fact that studies of iPFK-2 function indicate that the adipose tissue enzyme may play a role in the concept of healthy obesity. The vast majority of obese individuals will develop type 2 diabetes (T2D) and various cardiovascular diseases such as atherosclerosis. However, it has always been a scientific and clinical curiosity that a small percentage of overweight or obese individuals do not develop these same symptoms, the so-called healthy obese. In addition, it is known that certain thinner individuals may develop the types of health problems more typical of those associated with obesity.
When iPFK-2 expression is knocked-out in mice there is a reduction in diet-induced obesity but the negative consequences include an exacerbation of adipose tissue inflammation and enhanced insulin resistance. This observation led researchers to speculate that iPFK-2 expression may link metabolic and inflammatory responses and, therefore, could underlie the healthy obesity concept. Results from the converse experiment does indeed strengthen the idea of iPFK-2 underlying healthy obesity. When iPFK-2 is overexpressed in adipose tissue there results an increase in fat deposition in adipose tissue which equates with obesity. However, these mice have suppressed inflammatory responses along with improved insulin sensitivity in both adipose tissue and the liver. The latter being equated with healthy obesity.
Isoforms of the PFKFB3 encoded enzyme possess nuclear localization signals that allow for transport into the nucleus. Within the nucleus PFKFB3 produces F2,6BP which has been shown to lead to activation of cyclin dependent kinases (CDK). This activity of PFKFB3 in the nucleus promotes cell cycle progression and is associated with enhancement of tumor progression.
PFKFB4
The PFKFB4 gene is located on chromosome 3p21.31 and is composed of 21 exons that encode what is identified as the testis isoform. High level expression of the PFKFB4 gene is also seen in cancer cells and in response to hypoxia. Expression of the PFKFB4 gene is also found at high levels in the intestines.
The PFKFB4 encoded isoform also contains a nuclear localization signal allowing for accumulation in the nucleus. Within the nucleus PFKFB4 binds to the nuclear receptor co-activator, steroid receptor coactivator-3 (SRC-3). Upon binding to SRC-3 the kinase activity of PFKFB4 phosphorylates the co-activator. Phosphorylated SRC-3 interacts with the transcription ATF4 (activating transcription factor 4) which results in enhanced expression of several genes encoding metabolic enzymes. These enzymes include transketolase, adenosine monophosphate (AMP) deaminase-1 (AMPD1), and xanthine dehydrogenase (XDH). Xanthine dehydrogenase is converted to the purine catabolic enzyme, xanthine oxidase, via reversible sulfhydryl oxidation. The activation of these metabolic enzymes indicates that expression of PFKFB4 can enhance the proliferation of tumor cells, and this has indeed been found to be the case in several types of cancer.
Regulation of PFK-2 Activities
Rapid, short-term regulation of the kinase and phosphatase activities of PFK-2 is exerted by phosphorylation and dephosphorylation events. The liver isoform is phosphorylated at the N-terminus on Ser32, adjacent to the PFK-2 kinase domain, by PKA. This PKA-mediated phosphorylation results in inhibition of the PFK-2 kinase activity while at the same time leading to activation of the F-2,6-BPase activity of hepatic PFK-2.
In contrast, the heart isoform is phosphorylated at the C-terminus by several protein kinases in different signaling pathways, resulting in enhancement of the PFK-2 kinase activity. One of these heart kinases is AMPK and this activity allows the heart to respond rapidly to stress conditions that include ischemia. Insulin action in the heart also results in phosphorylation and activation of the PFK-2 kinase activity of the enzyme. This insulin-mediated effect is, in part, the result of the activation of PDK1 (PIP3-dependent protein kinase). For more information on the signaling pathways initiated by the actions of insulin go to the Insulin Function, Insulin Resistance, and Food Intake Control of Secretion page.
Under conditions where PFK-2 kinase activity predominates, fructose flow through the PFK-1/F-1,6-BPase reactions takes place in the glycolytic direction, with a net production of F1,6BP. When the bifunctional enzyme is phosphorylated it no longer exhibits kinase activity, but the activated phosphatase activity hydrolyzes F2,6BP to F6P and inorganic phosphate. The metabolic result of the phosphorylation of the bifunctional enzyme is that allosteric stimulation of PFK-1 ceases, allosteric inhibition of F-1,6-BPase is eliminated, and net flow of fructose through these two enzymes is gluconeogenic, producing F6P and eventually glucose.
Regulation of Glycolytic Flux by PKA
As indicated in the previous section, the interconversion of the activities of the bifunctional PFK-2 enzyme is catalyzed by cAMP-dependent protein kinase (PKA), which in turn is regulated by circulating peptide hormones. When blood glucose levels drop, pancreatic insulin production falls, glucagon secretion is stimulated, and circulating glucagon is highly increased. Hormones such as glucagon bind to plasma membrane receptors on liver cells, activating membrane-localized adenylate cyclase leading to an increase in the conversion of ATP to cAMP (see diagram below). cAMP binds to the regulatory subunits of PKA, leading to release and activation of the catalytic subunits. PKA phosphorylates numerous enzymes, including the bifunctional PFK-2, resulting in inhibition of the kinase activity of the enzyme, simultaneously activating the phosphatase activity. Under these conditions, the resultant drop in the levels of F-2,6-BP results in reduced PFK-1 activity and increased F-1,6-BPase activity. The net effect is that the liver stops consuming glucose and becomes metabolically gluconeogenic, producing glucose to reestablish normoglycemia.
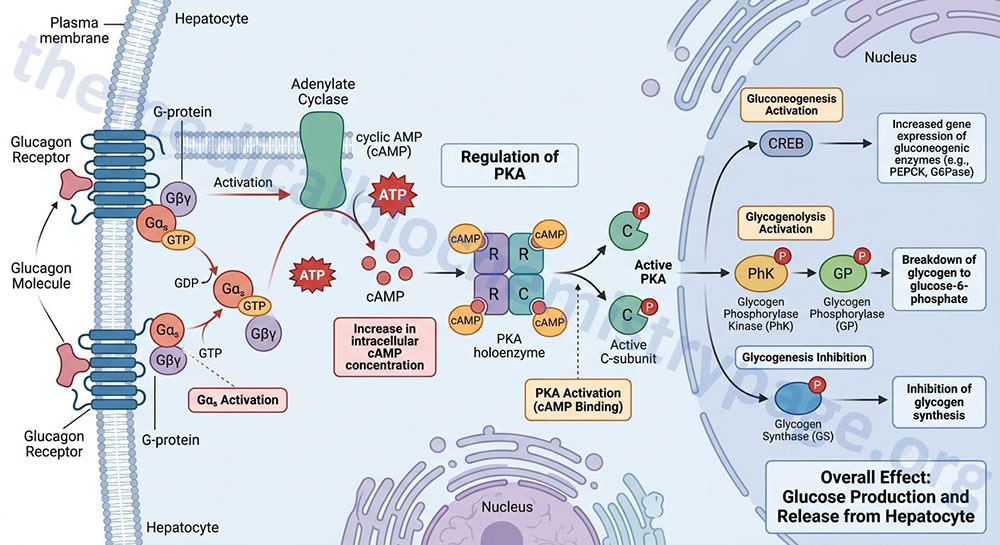
Humans express three different catalytic subunit genes, PRKACA (protein kinase cAMP-activated catalytic subunit alpha), PRKACB (protein kinase cAMP-activated catalytic subunit beta), PRKACG (protein kinase cAMP-activated catalytic subunit gamma).
The PRKACA and PRKACB genes constitute the predominant catalytic subunit genes expressed in hepatocytes.
Humans express four different PKA regulatory subunit genes, PRKAR1A (protein kinase cAMP-dependent type I regulatory subunit alpha), PRKAR1B (protein kinase cAMP-dependent type I regulatory subunit beta), PRKAR2A (protein kinase cAMP-dependent type II regulatory subunit alpha), and PRKAR2B (protein kinase cAMP-dependent type II regulatory subunit beta). These four genes encode four different proteins that exhibit tissue-specific patterns of expression and exert distinct roles in cell differentiation and growth control.
The PRKAR1A and PRKAR1B genes constitute the predominant regulatory subunit genes expressed in hepatocytes.
The original model proposed for the role of cAMP in the regulation of PKA suggested that two molecules of cAMP bind to each of the two regulatory subunits of PKA stimulating the release of the two catalytic subunits. Once released the catalytic subunits were free to phosphorylate serine and/or threonine residues in numerous target proteins. However, recent experimental data has found that active PKA remains in the heterotetrameric form and that cAMP functions, not to completely displace the catalytic subunits, but to facilitate the movement of the catalytic sites of the catalytic subunits away from the inhibitory domain of the regulatory subunits allowing the catalytic subunits to interact with, and phosphorylate, substrate proteins.
The activity of a given PKA isoform is ultimately regulated by its localization, such as cytosolic versus nuclear. Localization of PKA is effected by interaction with proteins of the A-kinase-anchoring protein (AKAP) family. Humans express 31 genes that encode proteins of the AKAP family. Proteins of the AKAP family that function in the localization of PKA to discrete subcellular locations do so by interaction with the regulatory subunits of the enzymes. The AKAP proteins also serve as docking sites for other proteins that contribute to the overall regulation of PKA activity such as phosphatases and phosphodiesterases. Indeed, the activity of PKA is self-limiting due to the fact that one of the substrates for the enzyme is a member of the cyclic nucleotide phosphodiesterase (PDE) family that when active hydrolyzes cAMP to AMP.
Within hepatocytes the AKAP1 gene is the predominantly expressed member of the AKAP family.
Regulation of Glycolytic Flux by Pyruvate Kinase
Regulation of glycolysis also occurs at the step catalyzed by pyruvate kinase, (PK). There are four distinct isoforms of PK in human tissues encoded for by two different genes. One is located on chromosome 1, identified as the PKLR gene, and it encodes the liver (PKL or L-PK) and erythrocyte (PKR or R-PK) pyruvate kinase proteins. Expression of PKL or PKR is dependent upon the use of tissue-specific promoter elements in the PKLR gene. The other pyruvate kinase gene is located on chromosome 15 and encodes two proteins identified as PKM1 and PKM2. The designation PKM reflects that fact that the enzyme was originally thought to be muscle specific in is expression.
The two PKM isoforms result from alternative splicing of the PKM gene. It is now known that most tissues express either the PKM1 of the PKM2 isoform. PKM1 is found in numerous normal differentiated tissues, whereas, PKM2 is highly expressed in hypoxic cells and in most proliferating cells. All cancers that have been examined for PK expression pattern show expression of the PKM2 isoform. Indeed, expression of PKM2 allows for a unique pathway of enhanced glucose oxidation to lactate in cancer cells.
The liver isoform (PKL or L-PK) has been most studied in vitro. This enzyme is inhibited by ATP and acetyl-CoA and is activated by F1,6BP. The inhibition of PK by ATP is similar to the effect of ATP on PFK-1. The binding of ATP to the inhibitor site reduces its affinity for PEP. The liver enzyme is also controlled at the level of synthesis. Increased carbohydrate ingestion induces the synthesis of L-PK resulting in elevated cellular levels of the enzyme. Regulation of L-PK is characteristic of a gluconeogenic tissue being regulated via phosphorylation by PKA. Whereas the M-type isozymes are unaffected by PKA. As a consequence of these differences, blood glucose levels and associated hormones can regulate the balance of liver gluconeogenesis and glycolysis while for instance, muscle metabolism remains unaffected.
In erythrocytes, the fetal PK isozyme has much greater activity than the adult isozyme; as a result, fetal erythrocytes have comparatively low concentrations of glycolytic intermediates. Because of the low steady-state concentration of fetal 1,3BPG, the 2,3BPG shunt (see diagram above) is greatly reduced in fetal cells and little 2,3BPG is formed. Since 2,3BPG is a negative effector of hemoglobin affinity for oxygen, fetal erythrocytes have a higher oxygen affinity than maternal erythrocytes. Therefore, transfer of oxygen from maternal hemoglobin to fetal hemoglobin is favored, assuring the fetal oxygen supply. In the newborn, an erythrocyte isozyme of the M-type with comparatively low PK activity displaces the fetal type, resulting in an accumulation of glycolytic intermediates. The increased 1,3BPG levels activate the 2,3BPG shunt, producing 2,3BPG needed to regulate oxygen binding to hemoglobin.
Genetic diseases of adult erythrocyte PK are known in which the kinase is virtually inactive. The erythrocytes of affected individuals have a greatly reduced capacity to make ATP and thus do not have sufficient ATP to perform activities such as ion pumping and maintaining osmotic balance. These erythrocytes have a short half-life due to easy lysis. Pyruvate kinase deficiency is the most common cause of inherited non-spherocytic hemolytic anemia and the second most common cause of inherited hemolytic anemia behind glucose-6-phosphate dehydrogenase (G6PD) deficiencies.
The liver PK isozyme is regulated by phosphorylation, allosteric effectors, and modulation of gene expression. The major allosteric effectors of PK are F1,6BP and ATP. Fructos-1,6-bisphosphate stimulates PK activity by decreasing its KM for PEP. On the other hand, ATP is an allosteric inhibitor of the liver PK enzyme. Expression of the liver PK gene is strongly influenced by the quantity of carbohydrate in the diet, with high-carbohydrate diets inducing up to 10-fold increases in PK concentration as compared to low carbohydrate diets. Liver PK is phosphorylated and inhibited by PKA, and thus it is under hormonal control similar to that described earlier for PFK-2.
Muscle PK (PKM1) is not regulated by the same mechanisms as the liver enzyme. Extracellular conditions that lead to the phosphorylation and inhibition of liver PK, such as low blood glucose and high levels of circulating glucagon, do not inhibit the muscle enzyme. The result of this differential regulation is that hormones such as glucagon and epinephrine favor liver gluconeogenesis by inhibiting liver glycolysis, while at the same time, muscle glycolysis can proceed in accord with needs directed by intracellular conditions.
Regulation of Glycolysis through Lactate Efflux
Lactate is transported out of cells, such as erythrocytes and skeletal muscle, via one of four members of the monocarboxylate transporter (MCT) family. These lactate transporters include MCT1 (SLC16A1 gene), MCT2 (SLC16A7 gene), MCT3 (SLC16A8 gene), and MCT4 (SLC16A3 gene). The MCT1 transporter is responsible for both lactate uptake (influx) and efflux from cells. Increased efflux of lactate contributes to an ability to oxidize more glucose. Of clinical significance is the fact that increased expression of the gene (SLC16A3) encoding MCT4 has been shown to be associated with increased flux of glucose through glycolysis in numerous human cancers.
Regulation of Glycolysis by Ubiquitylation
Experiments in cancer cells, which have elevated rates of glycolysis, have demonstrated that the expression of several genes encoding deubiquitylating enzymes (DUB) is upregulated in concert with most of the genes encoding glycolytic enzymes. The DUB that were identified include JOSD2 (josephin domain containing 2), USP5 (ubiquitin specific peptidase 5), STAMBP (signal transducing adapter molecule binding protein), PSMD7 (proteasome 26S subunit non-ATPase 7), and PSMD14. The significance of JOSD2 is that it is a positive regulator of glycolysis. Indeed, knockdown of JOSD2 levels in cancer cells reduces the rate of glycolysis. This effect is coincident with reduced abundance of the glycolytic enzymes, aldolase A, PFK-1, glyceraldehyde-3-phosphate dehydrogenase (GAPDH), glucose-6-phosphate isomerase (GPI), lactate dehydrogenase (both LDHA and LDHB), and the serine metabolic enzyme, phosphoglycerate dehydrogenase (PHGDH).
Evidence has demonstrated that the glycolytic enzymes, aldolase A and PFK-1, and the serine synthesis enzyme, phosphoglycerate dehydrogenase, exist in a complex. The JOSD2-mediated deubiquitylation of aldolase A, and in particular PFK-1, directly results in increased flux of glucose into the glycolytic pathway. With respect to cancer cell metabolism this is significant given that targeting the activity of JOSD2 could be therapeutic since its loss would lead to significantly reduced rates of glycolysis in these cells.
ChREBP is a Glucose-Regulated Transcription Factor
When glycogen stores are maximal in the liver, excess glucose is diverted into the lipid synthesis pathway as a direct result of the mechanisms activated by insulin in this organ. Glucose is catabolized to acetyl-CoA and the acetyl-CoA is used for de novo fatty acid synthesis. The fatty acids are then incorporated into triglycerides and exported from hepatocytes as very-low-density lipoproteins, VLDL (see the Lipoproteins, Blood Lipids, and Lipoprotein Metabolism page for more details) and ultimately stored as triglycerides in adipose tissue.
A diet rich in carbohydrates leads to stimulation of both the glycolytic and lipogenic pathways. Genes encoding glucokinase (GK) and liver pyruvate kinase (L-PK) of glycolysis and ATP-citrate lyase (ACLY), ACC1, and FAS of lipogenesis are regulated by modulation of their transcription rates. In addition, the enzymes encoded by these genes are subject to post-translational and allosteric regulation. These genes contain glucose- or carbohydrate-response elements (ChoRE) that are responsible for their transcriptional regulation.
One transcription factor that exerts control over glucose and lipid homeostasis is sterol-response element-binding protein (SREBP), in particular SREBP-1c. The regulation and actions of SREBP are discussed in the Cholesterol: Synthesis, Metabolism, and Regulation page. SREBP controls the expression of a number of genes involved in lipogenesis and its own transcription is increased by insulin and repressed by glucagon. However, SREBP activity alone cannot account for the stimulation of glycolytic and lipogenic gene expression in response to a carbohydrate rich diet.
A search for potential additional regulatory factors revealed a basic helix-loop-helix/leucine zipper (bHLH/LZ) transcription factor which was identified as carbohydrate-responsive element-binding protein (ChREBP). ChREBP is most highly expressed in the liver but is also abundantly expressed in white adipose tissue (WAT), brown adipose tissue (BAT), pancreatic β-cells, small intestine, kidney, adrenal glands, and brain. ChREBP was identified as a major glucose-responsive transcription factor and it is required for glucose-induced gene expression.
The details of ChREBP activity, the regulated expression of the gene (MLXIPL: MLX interacting protein like) encoding ChREBP, and the major targets of ChREBP are discussed in the ChREBP: Master Lipid Regulator in the Liver section in the Synthesis of Fatty Acids page.
Glucose Metabolism and Cancer: The Warburg Effect
It has been known for over 75 years that cancer cells metabolize glucose differently than differentiated cells. In 1924, Otto Warburg made an observation that cancer cells undertook glucose metabolism in a manner that was distinct from the glycolytic process of cells in normal tissues. Warburg discovered that, unlike most normal tissues, cancer cells tended to “ferment” glucose into lactate even in the presence of sufficient oxygen to support mitochondrial oxidative phosphorylation. This observation became known as the Warburg Effect.
In the presence of oxygen, most differentiated cells primarily metabolize glucose to CO2 and H2O by oxidation of glycolytic pyruvate in the mitochondrial TCA cycle. Originally postulated to be the result of mitochondrial dysfunction in cancer cells, it was subsequently shown that this was not the mitigating reason for the increased production of lactate in cancer cells. It might seem counterintuitive that highly proliferative cells, such as is characteristic of cancers, would bypass oxidation of pyruvate (from glucose) in mitochondria since this is the organelle where the vast majority of the ATP from glycolysis is generated. However, it has been shown that oncogenic mutations can result in the uptake of nutrients, particularly glucose and glutamine, that meet or exceed the bioenergetic demands of cell growth and proliferation. Proliferating cells, including cancer cells, require altered metabolism to efficiently incorporate nutrients such as glucose into biomass. The ultimate fate of glucose depends not only on the proliferative state of the cell but also on the activities of the specific glycolytic enzymes that are expressed. This is particularly true for pyruvate kinase, the terminal enzyme in glycolysis.
Pyruvate Kinase Isoforms Involved in Cancer
The roles of various pyruvate kinase isoforms in cancer development and progression are covered in greater detail in the Metabolic Alterations Associated with Cancer page.
Phosphoglycerate Mutase in PKM2 Expressing Cells
As described in greater detail in the Metabolic Alterations Associated with Cancer page, phosphoglycerate mutase is also involved in the changes in metabolism that occurs in cancer cells as a result of changes in pyruvate kinase isoform expression.
Glucose Metabolism and Cancer: The Hypoxia Induced Pathway
Altered metabolism of glucose is a hallmark of all types of cancer. The diversion of glucose carbons into biomass in cancer cells necessitates an increased delivery of glucose into these cells and an increase in the rate of anaerobic glycolysis to lactate. This is accomplished by an increase in the expression of genes encoding glucose transporters and glycolytic enzymes. These transcriptional changes can be observed in over 70% of human cancers and is driven in part through activation of the hypoxia induced factor 1 (HIF-1) pathway and by increased expression of various proto-oncogenes and decreased expression of various tumor suppressors.
The details of the role of the hypoxia induced factor pathway in metabolism is covered in the Hypoxia and Metabolism page whereas the role of this pathway in cancer is covered in detail in the Metabolic Alterations Associated with Cancer page.
The Glucose-Fatty Acid Cycle
The glucose-fatty acid cycle describes interrelationships of glucose and fatty acid oxidation as defined by fuel flux and fuel selection by various organs. This cycle is not a metabolic cycle such as can be defined by the TCA cycle as an example, but defines the dynamic interactions between these two major energy substrate pools. The glucose-fatty acid cycle was first proposed by Philip Randle and co-workers in 1963 and is, therefore, sometimes referred to as the Randle cycle or Randle hypothesis. The cycle describes how nutrients in the diet can fine-tune metabolic processes on top of the more coarse control exerted by various peptide and steroid hormones. The underlying theme of the glucose-fatty acid cycle is that the utilization of one nutrient (e.g. glucose) directly inhibits the use of the other (in this case fatty acids) without hormonal mediation. The general interrelationships between glucose and fatty acid utilization in skeletal muscle and adipose tissue that constitutes the glucose-fatty acid cycle are diagrammed in the Figure below.
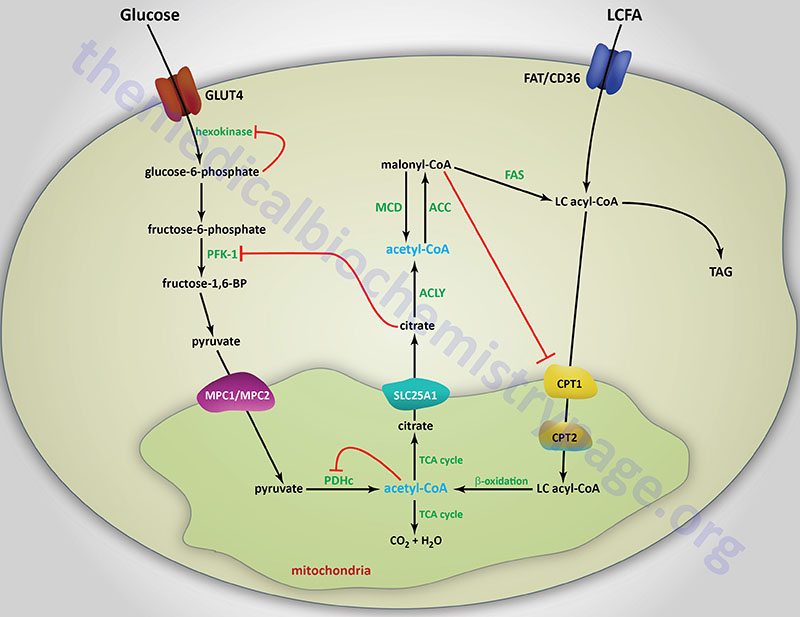
How do the dynamics of the glucose-fatty acid cycle play out under various physiological conditions and changing fuel substrate pools? In the fasted state it is imperative that glucose be spared so that the brain can have adequate access to this vital fuel. Under these conditions, hormonal signals from the pancreas and the adrenal gland, in the form of glucagon and epinephrine, respectively, stimulate adipose tissue lipolysis releasing free fatty acids (FFA) to the blood for use as a fuel by other peripheral tissues. When the released FFA enter the liver they oxidized and also serve as substrates for ketogenesis. The oxidation of fatty acids inhibits glucose oxidation as outlined in the above Figure. In addition to sparing glucose for the brain, fatty acid oxidation also preserves pyruvate and lactate which are important gluconeogenesis substrates. The effects of fatty acids on glucose utilization can also be observed in the well fed state after a high fat meal and during periods of exercise.
As outlined in the above Figure, the inhibition of glucose utilization by fatty acid oxidation is mediated by short-term effects on several steps of overall glycolysis that include glucose uptake, glucose phosphorylation and pyruvate oxidation. During fatty acid oxidation the resultant acetyl-CoA allosterically activates PDKs that phosphorylate and inhibit the PDHc. PDKs are also activated by increasing levels of NADH that will be the result of increased fatty acid oxidation. Thus, two products of fat oxidation result in inhibition of the PDHc.
In addition, excess acetyl-CoA is transported to the cytosol either as citrate (as diagrammed) or as acetylcarnitine. Mitochondrial acetylcarnitine is formed through the action of carnitine acetyltransferase (CAT). Acetylcarnitine is transported out of the the mitochondria via the action of carnitine-acylcarnitine translocase (CACT: SLC25A20). Once in the cytosol acetylcarnitine is converted to acetyl-CoA via the action of cytosolic CAT. In the cytosol, citrate serves as an allosteric inhibitor of PFK1, thus limiting entry of glucose into glycolysis. The increase in glucose-6-phosphate that results from inhibition of PFK1 leads to feed-back inhibition of hexokinase which in turn limits glucose uptake via GLUT4.
Additional mechanisms of fatty acid metabolism that lead to interference in glucose uptake and utilization are the result of impaired insulin receptor signaling. These latter processes are discussed in detail in the Insulin Function, Insulin Resistance, and Food Intake Control of Secretion page.
Mechanisms by which glucose utilization inhibits fatty acid oxidation are tissue specific due primarily to the differences in Km of hepatic glucokinase and skeletal muscle and adipose tissue hexokinase. In addition, hepatic CPT-1 is approximately 100-fold less sensitive to inhibition by malonyl-CoA than are the skeletal muscle and cardiac isoforms.
When glucose is oxidized via glycolysis the resultant pyruvate enters the mitochondria via the mitochondrial pyruvate carrier (MPC) complex. The MPC is a heterotetrameric complex composed of subunits encoded by the MPC1 and MPC2 genes. The MPC transporter proteins are members of the large superfamily of solute carrier (SLC) proteins and as such MPC1 is also identified as SLC54A1 and MPC2 is also identified as SLC54A2.
Increasing mitochondrial pyruvate inhibits the PDKs allowing for rapid decarboxylation of pyruvate by the PDHc ensuring continued entry of glucose into the glycolytic pathway. Some of the acetyl-CoA derived from pyruvate oxidation will be diverted from the TCA cycle as citrate and transported to the cytosol by the tricarboxylic acid transporter encoded by the SLC25A1 gene. The SLC25A1 encoded transporter is also identified as the mitochondrial citrate carrier (CiC).
Within the cytosol the citrate is converted to acetyl-CoA and oxaloacetate by ATP-citrate lyase (ACLY) and can now serve as a substrate for the rate-limiting enzyme of fatty acid synthesis, acetyl-CoA carboxylase (ACC). The resultant malonyl-CoA will inhibit CPT-1 thus, restricting mitochondrial uptake and oxidation of fatty acyl-CoAs. The inhibition of fatty acid oxidation in the liver re-routes long-chain fatty acids (LCFA) into triglycerides (TG or TAG). Long term effects of excess glucose are reflected in hepatic steatosis resulting from the diversion of fats into TG instead of being oxidized.
In addition to being regulated by intermediates of glucose and fat oxidation, several enzymes in these two pathways are regulated at the level of post-translational modification and/or gene expression. Most of these regulatory schemes have been covered in the above sections or in the Lipolysis and the Oxidation of Fatty Acids page.
Glucose Metabolism via the Polyol Pathway
Under conditions of excess glucose, such as is typical in diabetes mellitus, metabolism of glucose to fructose via the polyol pathway is enhanced in both the liver and the kidneys, as well as in nerves and the lens and retina of the eyes. The polyol pathway involves the reduction of glucose to sorbitol via the action of the NADPH-dependent aldose reductase encoded by the AKR1B1 (aldo-keto reductase family 1 member B) gene. This reaction depletes the NADPH pool in cells in which the AKR1B1 encoded enzyme is active. Sorbitol can then be oxidized to fructose via the action of sorbitol dehydrogenase encoded by the SORD gene. Evidence has shown that enhanced metabolism of glucose, via the polyol pathway, contributes to the vascular complications of diabetes, particularly within the kidneys.
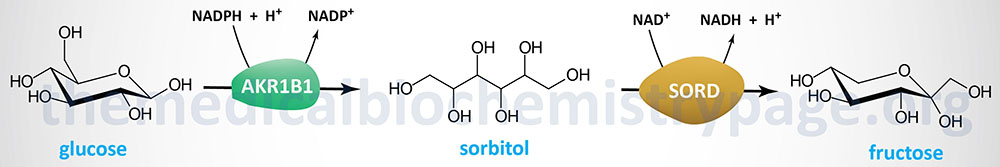
The AKR1B1 gene is located on chromosome 7q33 and is composed of 11 exons that generate two alternatively spliced mRNAs that encode proteins of 316 amino acids (isoform 1) and 172 amino acids (isoform 2). The highest levels of expression of the AKR1B1 gene are in the adrenal glands with the next highest levels, albeit at 10-fold lower levels than the adrenals, being in the kidneys and heart.
The SORD gene is located on chromosome 15q21.1 and is composed of 9 exons that encode a protein of 357 amino acids. The highest levels of expression of the SORD gene are found in the liver and kidney.
Aldose reductase is an NADPH-dependent enzyme and the majority of the required NADPH is derived from the pentose phosphate pathway (PPP). Under conditions of excess glucose, metabolism via the PPP is enhanced, particularly in the liver, thereby provided the required increase in NADPH. Sorbitol dehydrogenase, in the direction of sorbitol oxidation to fructose, utilizes NAD+ as a co-factor which increases the cellular levels of NADH. The increased NADH levels, as a result of the action of sorbitol dehydrogenase, disrupt the ability of the liver to carry out gluconeogenesis.
The metabolism of glucose to fructose via the polyol pathway is another mechanism by which excess glucose contributes to increased lipogenesis. As described in the Fructose Metabolism page, the generation of glyceraldehyde, from the pathway of fructose metabolism, significantly contributes to an enhancement in the synthesis of fatty acids and the synthesis of triglycerides.
Glucuronate Metabolism
Glucuronate is a highly polar molecule which is incorporated into proteoglycans as well as combining with bilirubin and steroid hormones; it can also be combined with certain drugs to increase their solubility. Glucuronate is derived from glucose in the uronic acid pathway.
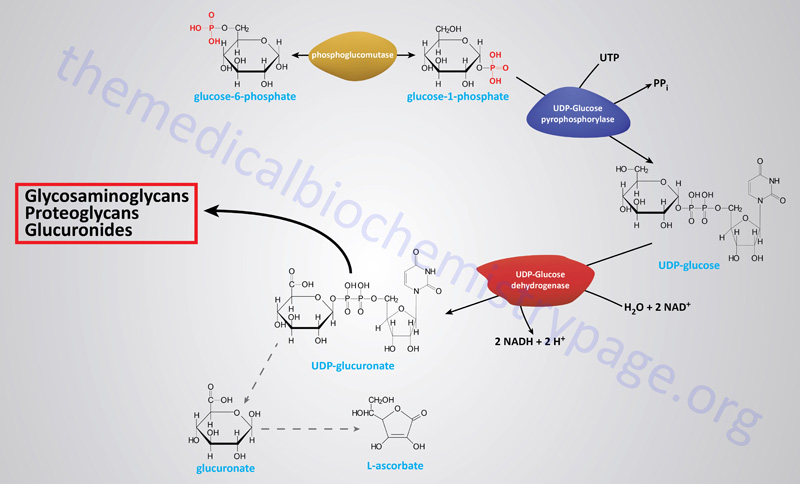
The uronic acid pathway is an alternative pathway for the oxidation of glucose that does not provide a means of producing ATP, but is utilized for the generation of the activated form of glucuronate, UDP-glucuronate. The uronic acid pathway of glucose conversion to glucuronate begins by conversion of glucose-6-phosphate to glucose-1-phosphate by phosphoglucomutase, and then activated to UDP-glucose by UDP-glucose pyrophosphorylase. UDP-glucose is oxidized to UDP-glucuronate by the NAD+-requiring enzyme, UDP-glucose dehydrogenase (encoded by the UGDH gene). UDP-glucuronate then serves as a precursor for the synthesis of iduronic acid and UDP-xylose and is incorporated into proteoglycans and glycoproteins or forms conjugates with bilirubin, steroids, xenobiotics, drugs and many compounds containing hydroxyl (–OH) groups.
Clinical Significance of Glucuronate
In the adult human, a significant number of erythrocytes die each day. This turnover releases significant amounts of the iron-free portion of heme, porphyrin, which is subsequently degraded. The primary sites of porphyrin degradation are found in the reticuloendothelial cells of the liver, spleen and bone marrow. The breakdown of porphyrin yields bilirubin, a product that is non-polar and therefore, insoluble. In the liver, to which is transported in the plasma bound to albumin, bilirubin is solubilized by conjugation to glucuronate. The soluble conjugated bilirubin diglucuronide is then secreted into the bile. An inability to conjugate bilirubin, for instance in hepatic disease or when the level of bilirubin production exceeds the capacity of the liver, is a contributory cause of jaundice.
The conjugation of glucuronate to certain non-polar drugs is important for their solubilization in the liver. There are numerous genes in the human genome that encode UDP-glucuronosyltransferases which themselves belong to the large superfamily of glycosyltransferases. There are four UDP-glucuronosyltransferase families in humans identified as the UGT1, UGT2, UGT3, and UGT8 families.
There are nine functional enzymes of the UGT1 family that are derived through the splicing of nine alternative first exons to the four common exons (2, 3, 4, and 5). These enzymes are designated UGT1A1–UGT1A9 (described in more detail in the Heme and Bilirubin Metabolism page).
The UGT2 gene family is composed of three UGT2A members (UGT2A1, UGT2A2, and UGT2A3) and seven UGT2B members (UGT2B4, UGT2B7, UGT2B10, UGT2B11, UGT2B15, UGT2B17, and UGT2B28).
The UGT3 family is composed of two members (UGT3A1 and UGT3A2). These enzymes are identified as UDP-glycosyltransferases.
The UGT8 family is composed of a single enzyme that is also identified as a UDP-glycosyltransferase.
Although the preferred substrate for these enzymes is UDP-glucuronate as the glycosyl donor, other UDP sugars (e.g. UDP-glucose and UDP-xylulose) may be used. Whereas most all of these enzymes catalyze reactions designed to detoxify both endogenous and exogenous (xenobiotic) compounds, the UGT8 encoded enzyme (UDP-glycosyltransferase 8; also identified as UDP-galactose ceramide galactosyltransferase and abbreviated CGT) carries out a biosynthetic reaction in galactocerebroside synthesis.
Glucuronate-conjugated drugs are more easily cleared from the blood by the kidneys for excretion in the urine. The glucuronate-drug conjugation system can, however, lead to drug resistance; chronic exposure to certain drugs, such as barbiturates and AZT, leads to an increase in the synthesis of the UDP-glucuronosyltransferases in the liver that are involved in glucuronate-drug conjugation. The increased levels of these hepatic enzymes result in a higher rate of drug clearance leading to a reduction in the effective dose of glucuronate-cleared drugs.
Regulation of Blood Glucose Levels
If for no other reason, it is because of the demands of the brain for oxidizable glucose and the absolute dependence on glucose metabolism by erythrocytes for energy that the human body exquisitely regulates the level of glucose circulating in the blood. This level is maintained in the range of 5mM (90mg/dL) during normal between meal fasting.
Nearly all carbohydrates ingested in the diet are converted to glucose following transport to the liver. Catabolism of dietary or cellular proteins generates carbon atoms that can be utilized for glucose synthesis via gluconeogenesis. Additionally, other tissues besides the liver that incompletely oxidize glucose (predominantly skeletal muscle and erythrocytes) provide lactate that can be converted to glucose via gluconeogenesis.
Maintenance of blood glucose homeostasis is of paramount importance to the survival of the human organism. The predominant tissue responding to signals that indicate reduced or elevated blood glucose levels is the liver. Indeed, one of the most important functions of the liver is to produce glucose for the circulation. Both elevated and reduced levels of blood glucose trigger hormonal responses to initiate pathways designed to restore glucose homeostasis. Low blood glucose triggers release of glucagon from pancreatic α-cells. High blood glucose triggers release of insulin from pancreatic β-cells.
Additional hormonal signals, such as via ACTH and growth hormone, released from the pituitary, act to increase blood glucose by inhibiting its uptake by extrahepatic tissues such as adipose tissue and skeletal muscle. Glucocorticoids also act to increase blood glucose levels by inhibiting glucose uptake (also primarily at the level of adipose tissue and skeletal muscle) and by stimulation of gluconeogenesis. Cortisol, the major glucocorticoid released from the adrenal cortex, is secreted in response to the increase in circulating ACTH. Within the liver, cortisol binding to the glucocorticoid receptor (GR), results in transcriptional activation of the PEPCK gene, thereby, resulting in increased rates of gluconeogenesis and glucose output to the blood.
The adrenal medullary hormone, epinephrine, stimulates production of glucose by activating hepatic glycogenolysis and gluconeogenesis. These effects are exerted via the presence of α1 and β2 adrenergic receptor subtypes on hepatocytes. Epinephrine also exerts an effect on skeletal muscle glycogenolysis in response to stressful stimuli. Within skeletal muscle, epinephrine exerts its effects primarily through activation of the β2 adrenergic receptor but a small percentage of the total adrenergic receptor subtypes in skeletal muscle includes the β1 subtype (7–10% of the total).
The significance of adrenergic (epinephrine primarily) receptor function to the control of blood glucose can be seen by the consequences of several identified receptor mutations. For example, mutations in either the β1 or the β3 adrenergic receptors are highly correlated to insulin resistance associated with type 2 diabetes. In addition, mutations in all three β-adrenergic receptors are associated with hyperlipidemia (which exacerbates the hyperglycemia of diabetes) as well as the associated pathophysiology of the metabolic syndrome. Mutations in all three β-receptors are also associated with increased risk for obesity.
Glucagon binding to its receptors on the surface of liver cells triggers an increase in cAMP production leading to an increased rate of glycogenolysis by activating glycogen phosphorylase via the PKA-mediated cascade. This is the same response hepatocytes have to epinephrine binding to the β2 adrenergic receptors on hepatocytes. The resultant increased levels of G6P in hepatocytes is hydrolyzed to free glucose, by glucose-6-phosphatase, which then diffuses to the blood. The glucose enters extrahepatic cells where it is re-phosphorylated by hexokinase. Since all tissues, excluding liver, kidney, and small intestine, lack glucose-6-phosphatase, the glucose-6-phosphate product of hexokinase is retained and oxidized by these tissues.
In opposition to the cellular responses to glucagon, cortisol, and epinephrine, insulin stimulates extrahepatic uptake of glucose from the blood and inhibits glycogenolysis in extrahepatic cells and conversely stimulates glycogen synthesis. As the glucose enters hepatocytes it binds to and inhibits glycogen phosphorylase activity. The binding of free glucose stimulates the dephosphorylation of phosphorylase thereby, inactivating it. Why is it that the glucose that enters hepatocytes is not immediately phosphorylated and oxidized? Hepatocytes express the isoform of hexokinase called glucokinase. Glucokinase has a much lower affinity for glucose than does hexokinase. Therefore, it is not fully active at the physiological ranges of blood glucose. Additionally, glucokinase is not inhibited by its product G6P, whereas, hexokinase is inhibited by G6P.
Hepatocytes, unlike most other cells, are essentially freely permeable to glucose and are, therefore, not directly affected by the action of insulin at the level of increased glucose uptake. When blood glucose levels are low, the liver does not compete with other tissues for glucose since the extrahepatic uptake of glucose is stimulated in response to insulin. Conversely, when blood glucose levels are high extrahepatic needs are satisfied and the liver takes up glucose for conversion into glycogen for future needs. Under conditions of high blood glucose, liver glucose levels will be high and the activity of glucokinase will be elevated. The G6P produced by glucokinase is rapidly converted to G1P by phosphoglucomutase, where it can then be incorporated into glycogen.
Role of the Kidney in Blood Glucose Control
Although the liver is the major site of glucose homeostasis, the kidney plays a vital role in the overall process of regulating the level of blood glucose. The kidney carries out gluconeogenesis primarily using the carbon skeleton of glutamine and while so doing allows for the elimination of waste nitrogen and maintaining plasma pH balance. For the role of the kidneys in gluconeogenesis please visit that section of the Gluconeogenesis page. In addition to carrying out gluconeogenesis, the kidney regulates blood glucose levels via its ability to excrete glucose via glomerular filtration as well as to reabsorb the filtered glucose in the proximal convoluted tubules. In the average adult the kidneys will filter around 180gm of glucose per day. Of this amount less than 1% is excreted in the urine due to efficient reabsorption. This reabsorption process is critical for maintaining blood glucose homeostasis and for retaining important calories for energy production.
Transport of glucose from the tubule into the tubular glomerular epithelial cells is carried out by specialized transport proteins termed sodium-glucose co-transporters (SGLTs). The SGLTs represent a family of transporters that are involved in the transport of glucose, amino acids, vitamins, and ions and other osmolytes across the brush-border (apical) membranes of kidney tubule cells and intestinal epithelial cells. There are two SGLT transporters in the kidney involved in glucose reabsorption. SGLT1 is found primarily in the distal S3 segment of the proximal tubule and SGLT2 is expressed in the S1 and S2 segments (see the Figure below). The location of SGLT2 in the proximal tubule means that it is primarily responsible for glucose reabsorption. SGLT2 is a high-capacity low-affinity transporter that, due to its expression location, is responsible for approximately 90% of the glucose reabsorption activity of the kidney.
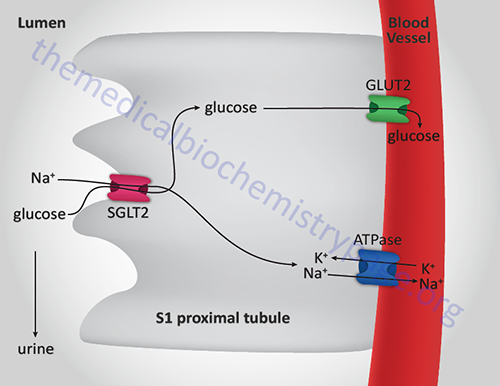
As would be expected from the name of the renal glucose transporters, SGLT1 and SGLT2 catalyze the active transport of glucose against a concentration gradient across the luminal (apical) membrane of the tubule cell and couple this transport to sodium uptake. The inward sodium uptake is maintained by ATP-driven active transport of the sodium across the basolateral membrane into the blood (coupled to inward uptake of potassium) via the activity of the renal Na+,K+-ATPase. The reabsorbed glucose passively diffuses out of the tubule cell into the blood via the basolateral membrane associated GLUT2. Under normal conditions saturation of the ability of SGLT2 to reabsorb glucose is never reached. The kidney can filter and reabsorb approximately 375mg of glucose per minute. The plasma concentration of glucose required to exceed this capacity is well above that considered normal and is only observed in situations of renal dysfunction/disease or most importantly in type 2 diabetes. Because of the importance of SGLT2 in renal reabsorption of glucose this transporter has become the target for therapeutic intervention of the hyperglycemia associated with type 2 diabetes. By specifically inhibiting SGLT2 there will be increased glucose excretion in the urine and thus, a lowering of plasma glucose levels. Several SGLT2-specific inhibitors have recently been approved for use in the treatment of the hyperglycemia of type 2 diabetes. All of the names of the drugs in the SGLT2 inhibitor class have the suffix, -gliflozin. For information on the SGLT2 inhibitors visit the Diabetes: Type 1 and Type 2 page.