

Last Updated: May 19, 2026
What is Obesity?
Obesity is defined as a physical condition in which an individual has a body mass index (BMI) ≥30kg/m2. The BMI is a measure of the relationship between an individuals weight and height. The BMI is calculated by dividing a persons weight in kilograms by the square of their height in meters. The medical utility for determining a persons BMI is that this measure describes the body weight relative to height and it thus, strongly correlates with the total body fat content in adults. It is important to note that in certain individuals, such as body builders who have large muscle mass, a high BMI does not correlate with high fat content. Given that most Americans measure their weight in pounds and their height in inches the following Table can be used to approximate ones weight from their BMI and their height in inches or their BMI from their approximate weight and their height in inches.
Table of BMI Values
| BMI (kg/m2) | 19 | 20 | 21 | 22 | 23 | 24 | 25 | 26 | 27 | 28 | 29 | 30 | 35 | 40 |
| Height (in) | Weight (lb) | |||||||||||||
| 58 | 91 | 96 | 100 | 105 | 110 | 115 | 119 | 124 | 129 | 134 | 138 | 143 | 167 | 191 |
| 59 | 94 | 99 | 104 | 109 | 114 | 119 | 124 | 128 | 133 | 138 | 143 | 148 | 173 | 198 |
| 60 | 97 | 102 | 107 | 112 | 118 | 123 | 128 | 133 | 138 | 143 | 148 | 153 | 179 | 204 |
| 61 | 100 | 106 | 111 | 116 | 122 | 127 | 132 | 137 | 143 | 148 | 153 | 158 | 185 | 211 |
| 62 | 104 | 109 | 115 | 120 | 126 | 131 | 136 | 142 | 147 | 153 | 158 | 164 | 191 | 218 |
| 63 | 107 | 113 | 118 | 124 | 130 | 135 | 141 | 146 | 152 | 158 | 163 | 169 | 197 | 225 |
| 64 | 110 | 116 | 122 | 128 | 134 | 140 | 145 | 151 | 157 | 163 | 169 | 174 | 204 | 232 |
| 65 | 114 | 120 | 126 | 132 | 138 | 144 | 150 | 156 | 162 | 168 | 174 | 180 | 210 | 240 |
| 66 | 118 | 124 | 130 | 136 | 142 | 148 | 155 | 161 | 167 | 173 | 179 | 186 | 216 | 247 |
| 67 | 121 | 127 | 134 | 140 | 146 | 153 | 159 | 166 | 172 | 178 | 185 | 191 | 223 | 255 |
| 68 | 125 | 131 | 138 | 144 | 151 | 158 | 164 | 171 | 177 | 184 | 190 | 197 | 230 | 262 |
| 69 | 128 | 135 | 142 | 149 | 155 | 162 | 169 | 176 | 182 | 189 | 196 | 203 | 236 | 270 |
| 70 | 132 | 139 | 146 | 153 | 160 | 167 | 174 | 181 | 188 | 195 | 202 | 207 | 243 | 278 |
| 71 | 136 | 143 | 150 | 157 | 165 | 172 | 179 | 186 | 193 | 200 | 208 | 215 | 250 | 286 |
| 72 | 140 | 147 | 154 | 162 | 169 | 177 | 184 | 191 | 199 | 206 | 213 | 221 | 258 | 294 |
| 73 | 144 | 151 | 159 | 166 | 174 | 182 | 189 | 197 | 204 | 212 | 219 | 227 | 265 | 302 |
| 74 | 148 | 155 | 163 | 171 | 179 | 186 | 194 | 202 | 210 | 218 | 225 | 233 | 272 | 311 |
| 75 | 152 | 160 | 168 | 176 | 184 | 192 | 200 | 208 | 216 | 224 | 232 | 240 | 279 | 319 |
| 76 | 156 | 164 | 172 | 180 | 189 | 197 | 205 | 213 | 221 | 230 | 238 | 246 | 287 | 328 |
Obesity is approaching epidemic proportions in the US and many other industrialized countries. In the US the prevalence of obesity now exceeds 30% of the population and represents the highest rate of obesity worldwide. Since 1980 the prevalence of obesity in adults in the US has increased 2-fold. However, much more disturbing is the fact that in this same time period the rate of childhood and adolescent obesity increased 3-fold. The Table below associates a given BMI range with the risk for cardiovascular disease and atherosclerosis.
Table of Criteria for Designation of Adult Weight and Health Status
| BMI | Category | Waist less than or equal to 40 in. (men) or 35 in. (women) | Waist greater than 40 in. (men) or 35 in. (women) |
| 18.5 or less | underweight | N/A | N/A |
| 18.5 – 24.9 | normal | N/A | N/A |
| 25.0 – 29.9 | overweight | increased risk | high risk |
| 30.0 – 34.9 | obese | high risk | very high risk |
| 35.0 – 39.9 | obese | very high risk | very high risk |
| 40 or greater | extremely obese | extremely high risk | extremely high risk |
Obesity is associated with several serious and life threatening complications resulting in significant increases in morbidity and mortality relative to lean individuals. These complications include insulin resistance (IR), type 2 diabetes, metabolic dysfunction associated fatty liver disease (MAFLD), atherosclerosis, degenerative disorders such as dementia, and also in many instances, various cancers. The combination of abdominal obesity, hyperlipidemia, IR, pro-inflammatory status, and hypertension is clinically referred to as the Metabolic Syndrome. Many of these conditions are discussed in this page and elsewhere in this site.
It should be noted that MAFLD was previously designated by the terminology, non-alcoholic fatty liver disease (NAFLD). MAFLD is also often referred to as metabolic dysfunction-associated steatotic liver disease, MASLD.
Healthy Versus Unhealthy Obesity
Not all individuals who carry excess weight, that would classify these individuals as obese, manifest with the metabolic disturbances and associated diseases that are classically associated with obesity. This situation is sometimes, and somewhat erroneously, referred to as healthy obesity. Nonetheless, from a metabolic perspective there is a form of healthy obesity and it is correctly defined as metabolically healthy obesity.
In unhealthy obesity the characteristic metabolic disturbances are prediabetes, hepatic steatosis, and whole-body insulin resistance. In contrast, metabolically healthy obesity is associated with normal fasting glucose, normal fasting triglycerides, normal responses to an oral glucose tolerance test, normal intrahepatic triglyceride content, and normal whole-body insulin sensitivity. These metabolic characteristics of metabolically healthy obesity are identical to those identified in lean individuals who are metabolically healthy.
The ability to carry out large scale metabolomic studies has allowed for detailed comparisons between metabolically healthy and metabolically unhealthy obese individuals. These types of studies have found that the composition of skeletal muscle membrane lipids (e.g. plasma and mitochondrial membranes) are different when comparing the metabolically healthy versus unhealthy obese individuals. In particular, the mitochondrial ceramide content in metabolically unhealthy obese individuals was higher, particular with respect to stearic acid (C18:0), docosanoic acid (C22:0; trivial name behenic acid), cis-15-tetracosenoic acid (C24:1; trivial name nervonic acid), and tetracosanoic acid (C24:0; trivial name lignoceric acid) containing ceramides. This is significant given that there is ample evidence demonstrating an inverse correlation between skeletal muscle ceramide content and insulin sensitivity.
Obesity and Development of the Metabolic Syndrome
A little more than 20 years ago Dr. Gerald M. Reaven put forth the concept that the insulin resistance syndrome was the root cause of glucose intolerance, elevated LDL along with reduced HDL, and hypertension. This clinical concept has evolved into what is now referred to as the metabolic syndrome. The metabolic syndrome, MetS (also once referred to as Syndrome X), is a disorder that defines a combination of metabolic and cardiovascular risk determinants. These risk factors include insulin resistance, hyperinsulinemia, central adiposity (obesity associated with excess fat deposits around the waist), dyslipidemia, glucose intolerance, hypertension, pro-inflammatory status, and microalbuminemia. The hallmark feature of MetS is indeed insulin resistance.
Several other clinical abnormalities have recently been associated with MetS including metabolic dysfunction-associated fatty liver disease (MAFLD), atherosclerosis, oxidative stress, and polycystic ovary syndrome (PCOS). MAFLD has also been referred to as metabolic dysfunction-associated steatotic liver disease (MASLD) as was originally identified as non-alcoholic fatty liver disease, NAFLD.
Similar to the re-identification of NAFLD as MASLD due to the realization of the broad metabolic dysfunction of the disorder, PCOS has also undergone a re-imagining of the best way to describe the disorder. It has long been understood that PCOS, as a disorder, is much more than just pathological ovarian cysts and in fact encompasses diverse endocrine and metabolic features and that these features contribute to delayed definitive diagnosis and a resulting fragmentation in delivery of care. As a result it has been suggested that a more useful and informative descriptor for this disorder should be polyendocrine metabolic ovarian syndrome (PMOS).
Although obesity, ectopic fat accumulation, and an inflammatory status are central to the pathology of MetS, not all obese individuals develop MetS and not all individuals with MetS are obese. These observations indicate that MetS has a multifactorial etiology that involves a series of complex interactions between a particular individuals dietary habits, exercise habits, hormonal status, and genetic background. Increasing evidence indicates that the risk of MetS can be developmentally induced. Epidemiological studies in humans and animal models of MetS demonstrate an association between poor nutrition (excess maternal caloric intake) during fetal development and an increased future risk of adult cardiovascular disease.
Given the complexities of the factors contributing to the metabolic syndrome numerous health groups in various countries have defined the disorder with slightly different criteria. Some health organizations believe that insulin resistance is the signal most important predictor for future development of type 2 diabetes and cardiovascular disease that the disorder is defined as the insulin resistance syndrome. In addition, there are significant differences in ethnic predisposition to the effects of the dysfunctions of the metabolic syndrome that some criteria must be assessed with this in mind. Of particular note is the use of waist circumference as an indicator of obesity. The following Table lists the criteria set forth by the American Heart Association and the National Heart, Lung and Blood Institute as defining the metabolic syndrome.
Table of Criteria Defining the Metabolic Syndrome
| Defining Criteria | Parameters of Criteria |
| elevated fasting blood glucose | ≥ 100 mg/dL (≥ 5.6mmol/L) |
| elevated waist circumference | ≥ 102 cm (≥ 40 inches) in men ≥ 88cm (≥ 35 inches) in women |
| elevated triglycerides | ≥ 150mg/dL (≥ 1.7mmol/L) |
| reduced HDL cholesterol (HDLc) | < 40mg/dL (< 1.03mmol/L) in men < 50mg/dL (< 1.3mmol/L) in women |
| elevated blood pressure | ≥ 130mm Hg systolic or ≥ 85mm Hg diastolic |
Although MetS is not exclusively associated with type 2 diabetes and the associated insulin resistance, the increasing prevalence of obesity and associated development of type 2 diabetes places insulin resistance as a major contributor to the syndrome. As indicated, the metabolic syndrome is defined as a clustering of atherosclerotic cardiovascular disease risk factors that include visceral adiposity (obesity), insulin resistance, low levels of HDL and a systemic proinflammatory state. There are key components to the metabolic syndrome which include in addition to insulin resistance (the hallmark feature of the syndrome), hypertension, dyslipidemia, chronic inflammation, impaired fibrinolysis, procoagulation, and most telling, central obesity.
The role of adipose tissue stems from the fact that the organ is active at secretion of cytokines, termed adipocytokines. These include tumor necrosis factor-α (TNFα), interleukin-6 (IL-6), leptin, adiponectin, and resistin. Leptin has received particular attention of late due to its role in obesity in addition to the fact that recent data indicates that plasma leptin levels are found to be predictive of the potential for cardiovascular pathology.
Many clinicians and researchers believe that insulin resistance underlies the cardiovascular pathologies of the metabolic syndrome. One primary reason for this is the role of insulin in fat homeostasis. As indicated above, the major role of insulin is to induce the storage of fuel. This can be as fat (triglycerides, TG) in adipose tissue or as carbohydrate in the form of glycogen in liver and skeletal muscle. The effect of insulin resistance at the level of fat homeostasis is an increase in circulating TG, referred to as dyslipidemia. Due to insulin resistance there is an increase in the delivery of peripheral fatty acids to the liver which in turn drives hepatic TG synthesis. These TG are then packaged into lipoprotein particles termed VLDL (very low density lipoproteins) which are returned to the circulation contributing to hyperlipidemia.
An additional role of insulin resistance in the overall cardiac pathology associated with the metabolic syndrome relates to the normal role of insulin in platelet function. In platelets, insulin action leads to an increase in endothelial nitric oxide synthase (eNOS) activity that is due to its phosphorylation by AMPK. Activation of NO production in platelets leads to a decrease in thrombin-induced aggregation, thereby, limiting the pro-coagulant effects of platelet activation. This response of platelets to insulin function clearly indicates why disruption in insulin action is a major contributing factor in the development of the metabolic syndrome. Taken together, the insulin resistance and its associated negative effects on metabolism, the increased levels of circulating TG, the reduced levels of HDL and hypertension, all contribute to the progression of atherosclerosis. With associated coagulation and fibrinolysis pathologies, the cardiovascular events of the metabolic syndrome can be devastating.
Although, as indicated above, there are many examples of individuals who are obese but do not manifest MetS there is still a very strong correlation between obesity and increased risk for development of MetS. In addition, the incidence of MetS increases with the severity of obesity. It has been observed that over 50% of obese adolescents go on to develop MetS. Also, given the high correlation between MetS and insulin resistance it is not at all surprising that there is a strong link between obesity and MetS. Insulin resistance (identified as type 2 diabetes) is 5 to 6 times more common in individuals with a body mass index (BMI) >30kg/m2 than in individuals of normal weight.
Although the precise mechanism(s) by which obesity leads to the development of MetS is not fully understood, there are many overlapping pathways of metabolism that are disrupted in obesity that can be identified as important in the progression to MetS. Not the least of which is the role that obesity, in particular visceral obesity, plays in the progression to insulin resistance. Recall that as mentioned above, insulin resistance is the hallmark manifestation of MetS.
Epigenetic Factors in Metabolic Syndrome
Numerous epidemiological studies have implicated developmental origins in the progression to the metabolic syndrome. There appears to be a clear correlation between poor nutritional status of the mother during fetal development and the potential for increased risk for MetS to her child in later life. These correlations have also been observed in animal studies where prenatal diets in mothers impacts their offspring. Overfeeding during of the mother during fetal development as well as excessive nutritional intake by the mother during the pre-weaning period of postnatal development results in increased obesity, adipocyte hypertrophy, reduced activity, insulin resistance, elevated blood pressure, endothelial cell dysfunction, and altered cardiovascular and renal function in offspring. When mothers are obese and fed high-fat diets during fetal development their adult offspring exhibit impaired glucose tolerance, hyperinsulinemia, dyslipidemia, hypertension, resistance to the anorexic actions of the leptin on the hypothalamus, and develop MAFLD. Additional evidence indicates that manipulation of fetal protein access leads to modified pancreatic islet cell expansion resulting in reduced pancreatic β-cell mass and persistent deficits in glucose homeostasis.
There is now a clear link between maternal dietary status and future development of MetS in adult offspring. Likewise, because the risks of metabolic syndrome in the general population, due to identified inherited polymorphisms is relatively small, the huge increase in the numbers of individuals with the disorder is most likely due to epigenetic changes that occur during early fetal development. The role of epigenetics in transgenerational disease manifestation has been outlined in several studies on the outcomes of children born to parents who experienced famine while pregnant. These children are far more likely to develop diabetes, obesity, and cardiovascular disease than children from parents of similar backgrounds who were not nutritionally deprived. Of striking significance is that the second generation children (grandchildren of the starved mothers) were more likely to be born with low birth weight regardless of the nutritional status of their mothers.
The potential for diet and nutrition to effect epigenetic changes in offspring on multiple generations has been conclusively demonstrated in animal models. In mice, the lack of adequate fetal nutrition results in a reduction in the methylation status of the promoter regions of several transcriptional regulators. Hypomethylation of genes is most often associated with increased transcriptional activation. One transcriptional regulator of key metabolic significance whose promoter has been found to be hypomethylated in offspring of nutritionally deprived mothers is PPARα. PPARα is highly expressed in the liver, skeletal muscle, heart, and kidney. Its function in the liver is to induce hepatic peroxisomal fatty acid oxidation during periods of fasting. Expression of PPARα is also seen in macrophage foam cells and vascular endothelium. Its role in these cells is thought to be the activation of anti-inflammatory and anti-atherogenic effects. For a detailed discussion of the PPAR family of transcriptional regulators visit the PPAR page.
Gene Polymorphisms Associated with Obesity
Overweight and obese states have a complex etiology involving both an individuals genetic composition and their interactions with the environment. With respect to the genetic components of obesity, hundreds of genes have been identified whose encoded proteins play a role in the modulation anthropometric (of or relating to the scientific study of the measurements and proportions of the human body) traits. Familial associations of body size were first reported by Sir Francis Galton in 1894. Twin studies have shown that genetic inheritance contributes towards 40%–75% of obesity cases. Monozygotic twins exhibit a much higher level of similar body fat acquisition when compared with dizygotic twins, further indicating a link between altered energy balance and genotype.
The genetics of obesity encompasses monogenic, oliogenic, and polygenic obesity as well as epigenetic regulation of anthropometric traits. Monogenic obesity is exceptionally rare and, in addition to being associated with obesity is also characterized by intellectual impairment, dysmorphic features and organ specific abnormalities. More than 30 obesity syndromes have been described such as Prader-Willi syndrome (PWS), however, the precise molecular mechanisms for many of these disorders has yet to be defined. The term non-syndromic monogenic obesity refers to a disorder where a single gene mutation has been identified as the cause.
The first single gene association with monogenic obesity was with the leptin receptor gene (LEPR). Another important gene (SH2B1) associated with monogenic obesity encodes SH2B adaptor protein 1. The SH2B1 encoded protein is a key regulator of leptin signaling via its role in stimulating Janus kinase 2 (JAK2) activity and assembling a signaling complex of JAK2 and insulin receptor substrate 1 (IRS1). Loss-of-function mutations in SH2B1 patients results in severe early-onset obesity.
Mutations in the proopiomelanocortin (POMC) gene are also associated with obesity due to a dramatic increase in feeding behavior. Patients with POMC mutations also display hypocortisolism, red hair, skin hypopigmentation, neonatal hypoglycemia, seizures, and cholestasis. The proprotein convertase subtilisin/kexin 1 enzyme is responsible for the processing of proinsulin to insulin and in the release of α-melanocyte-stimulating hormone (α-MSH) from POMC. Mutations in the PCSK1 gene, which encodes proprotein convertase subtilisin/kexin type 1, result in early-onset obesity, hyperphagia, postprandial hypoglycemia, and endocrine dysfunction. The primary receptor for α-MSH is the melanocortin 4 receptor encoded by the MC4R gene. Heterozygous and homozygous mutations in the MC4R gene are associated with hyperphagia, rapid weight gain, hyperinsulinemia, increased linear growth, and an increase in bone mass.
Heterozygosity for mutations in the POMC and MC4R genes, as well as in the case of several other obesity-related genes, are not fully penetrant but significantly increase the likelihood of obesity when in the presence of other mutations and/or the environment. This concept of predisposition, due to heterozygous mutations in obesity-related genes represents the definition of oligogenic obesity. Mutations in the leptin gene (LEP) and the LEPR gene that result in partial deficiency are associated with oligogenic obesity as are heterozygous mutations in the PCSK1 gene and the melanocortin 3 receptor (MC3R) gene.
Polygenic obesity is defined as that form being the result of multiple gene defects and their effects interacting with the environment. Genome-wide association studies (GWAS) have been the most useful in the discovery of genes associated with polygenic obesity. Polygenic obesity has been associated with polymorphisms in the free fatty acid receptor 4 gene (FFAR4: previously identified as G protein-coupled receptor 120, GPR120), the ectonucleotide pyrophosphatase/phosphodiesterase 1 gene (ENPP1), TBC1 domain family member 1 gene (TBC1D1), and the fat mass and obesity-associated (FTO) gene. Altered FTO function results in increased expression of the iroquois homeobox 3 (IRX3) and iroquois homeobox 5 (IRX5) genes during early adipocyte differentiation leading to a shift from energy-dissipating beige adipocytes to energy-storing white adipocytes, and thus, obesity. Polymorphisms in the IRX3 gene are also associated with polygenic obesity, however, the mechanisms are complex with respect to IRX3 since loss of expression in adipocytes would lead to reduced fat storage but loss of expression of IRX3 in the hypothalamus leads to hyperphagia and exacerbates obesity.
The following Table is not intended to display all of the genes that have been identified as having an association with obesity. This list is intended as a representative list only.
Table of Gene Polymorphisms Associated with Obesity
| Gene Polymorphisms Associated with Obesity Susceptibility | ||
| Gene Name | Gene Symbol | Gene Function, Comments |
| ATP binding cassette subfamily A member 1 | ABCA1 | involved in cellular cholesterol efflux; transfers cellular cholesterol and phospholipids to HDL (reverse cholesterol transport); also involved in transport of retinyl esters from intestinal enterocytes into the portal circulation; defects in gene associated with development of Tangier disease |
| brain-derived neurotrophic factor | BDNF | is a member of the neurotrophin family of growth factors; supports survival of existing neurons, stimulates growth and differentiation of new neurons and synapses; mutations in BDNF gene associated with hyperphagia, severe obesity, cognitive impairment, and hyperactivity |
| carboxypeptidase E | CPE | also known as carboxypeptidase H and enkephalin convertase; catalyzes the release of C-terminal arginine or lysine residues from most neuropeptides and peptide hormones; polymorphisms in gene associated with obesity, hypogonadotropic hypogonadism, and developmental delay |
| ectonucleotide pyrophosphatase/phosphodiesterase 1 | ENPP1 | type II transmembrane enzyme involved in metabolism of ATP to AMP and PPi; mutations in the gene are associated with insulin resistance that may be the contributing factor to obesity in patients harboring mutant ENPP1 genes |
| free fatty acid receptor 4 | FFAR4 | activated by long-chain non-esterified fatty acids (NEFAs) in particular in the intestines by α-linolenic acid (ALA), an omega-3 polyunsaturated fatty acid (PUFA); activation of FFAR4 in the intestines results in increased GLP-1 secretion from enteroendocrine L cells; also activated by docosahexaenoic acid (DHA) another omega-3 PUFA; highly expressed in adipose tissue, and proinflammatory macrophages |
| fat mass- and obesity-associated gene | FTO | is a member of the ALKB homolog (ALKBH) family of enzymes and as such is also identified as ALKBH9; catalyzes the 2-oxoglutarate and Fe2+-dependent demethylation of N6-methyladenosine in mRNA; expression upregulated in hypothalamus in response to food intake; increased expression in hypothalamus regulates energy intake but does not affect feeding reward circuits; critical downstream targets of FTO activity are the iroquois homeobox 3 (IRX3) and IRX5 genes resulting in increases in their expression |
| iroquois homoebox 3 | IRX3 | homeobox transcription factor involved in early neural development; is expressed in the hypothalamus and is involved in feeding control circuits; expression in adipose tissue drives conversion to white adipocytes and fat storage; overexpression of IRX3 in adipose tissue contributes to obesity; loss of expression of IRX3 in the hypothalamus induces hyperphagia |
| leptin | LEP | details of leptin function covered in the Adipose Tissue: Not Just Fat page; gene polymorphisms associated with obesity, hyperphagia, hypogonadism, frequent infections, neurological and endocrine dysfunctions |
| leptin receptor | LEPR | leptin receptor is a member of the class I cytokine receptor family; leptin receptor mRNA is alternatively spliced resulting in six different products named named Ob-R, OB-Rb, OB-Rc, Ob-Rd, Ob-Re, and Ob-Rf the OB-Rb mRNA encodes the long form of the leptin receptor (also called LEPR-B) and is expressed primarily in the hypothalamus but is also expressed in cells of the innate and adaptive immune systems as well as in macrophages; the other receptor subtypes are expressed in numerous tissues including muscle, liver, kidney, adrenal glands, leukocytes, and vascular endothelium; activation of the leptin receptor leads to increased phosphatidylinositol-3-kinase (PI3K) activity, while simultaneously inhibiting AMPK activity, via activation of the Jak/STAT signaling pathway; within the hypothalamus, the inhibition of AMPK activity is a major contributor to the anorexigenic actions of leptin, decreased hypothalamic AMPK activity results in reduced inhibition of the rate limiting enzyme of fatty acid synthesis, acetyl-CoA carboxylase (ACC); in the absence of hypothalamic leptin the increased ACC activity leads to increased production of malonyl-CoA which is a potent modulator of hypothalamic inhibition of feeding behavior which explains why mutations in LEPR can promote obesity |
| melanocortin 4 receptor | MC4R | is a single exon (intronless) gene; receptor binds α-melanocyte stimulating hormone (α-MSH); mutations in this gene are the most frequent genetic cause of severe obesity associated with hyperphagia, rapid weight gain, increased fat mass, hyperinsulinemia, increased linear growth, increase in bone mass |
| nuclear receptor coactivator 1 | NCOA1 | possesses histone acetyltransferase activity; is commonly referred to as steroid receptor coactivator 1, SRC-1 which is why the SRC subfamily of histone acetyltransferases is so named; SRC subfamily is composed of three members encoded by the NCOA1, NCOA2 (originally GRIP1 for glucocorticoid receptor-interacting protein 1 and also as TIF2 for transcriptional intermediary factor 2), and NCOA3 (originally identified as SRC-3) genes |
| NPC intracellular cholesterol transporter 1 | NPC1 | is an integral membrane protein that contains regions of homology to mediators of cholesterol homeostasis; contains regions of homology to the transmembrane domain of the morphogen receptor patched (of Drosophila melanogaster) and the sterol-sensing domains (SSDs) of SCAP [SREBP (sterol regulated element binding protein) cleavage-activating protein] and HMG-CoA reductase (HMGR); primarily associated with intraluminal vesicles and multi-vesicular late endosomes; the proposed major function of NPC1 is to facilitate the movement of cholesterol out of late endosomes |
| proprotein convertase subtilisin/kexin type 1 | PCSK1 | encodes the protein that is historically identified as prohormone convertase 1/3 (PC1/3); responsible for the processing of proinsulin to insulin and in the release of α-melanocyte-stimulating hormone (α-MSH) from POMC; mutations in gene result in early-onset obesity, hyperphagia, postprandial hypoglycemia, diarrhea, diabetes insipidus, and other endocrine dysfunctions |
| proopiomelanocortin | POMC | see the Gut-Brain Interrelationships and the Control of Feeding Behaviors page |
| peroxisome proliferator-activated receptor-γ | PPARG | transcriptional co-activator with retinoid X receptors (RXR), master regulator of adipogenesis, activation of adipocyte differentiation leads to increased fat storage and secretion of insulin-sensitizing adipocytokines such as adiponectin |
| SH2B adaptor protein 1 | SH2B1 | is an adapter protein for several members of the receptor tyrosine kinase (RTK) family; involved in multiple signaling pathways mediated by JAK; is activated by the receptor for insulin, insulin-like growth factor I (IGF1), nerve growth factor (NGF), brain-derived neurotrophic factor (BDNF), and fibroblast growth factors (FGFs) as well as several additional factors that bind to members of the RTK family |
| glucose transporter 3 (GLUT3) | SLC2A3 | found primarily in neurons but also found in the intestine; binds glucose with high affinity (has the lowest Km of the GLUTs) which allows neurons to have enhanced access to glucose especially under conditions of low blood glucose |
| TBC1 domain family member 1 | TBC1D1 | involved in the trafficking and translocation of GLUT4-containing vesicles to the plasma membrane of skeletal muscle cells and adipocytes in response to insulin signaling; failure of these two tissues to take up glucose in response to insulin, as is the case in the insulin resistance of type 2 diabetes, contributes to hyperlipidemia |
| transcription factor 7-like 2 (T-cell specific HMG-box) | TCF7L2 | one of four TCF transcription factor proteins involved in the signaling pathways initiated by the Wnt family of secreted growth factors, polymorphisms in this gene have the highest correlation to type 2 diabetes |
Hypothalamic Control of Appetite
The hypothalamus is located below the thalamus and just above the brain stem and is composed of several domains (nuclei) that perform a variety of functions. The hypothalamus forms the ventral portion of the region of the brain called the diencephalon. Anatomically the hypothalamus is divided into three broad domains termed the posterior, tuberal, and anterior regions. Each of these three regions is further subdivided into medial and lateral areas. The various nuclei of the hypothalamus constitute the functional domains of the various hypothalamic areas.
The primary nuclei of the hypothalamus that are involved in feeding behaviors and satiety (the sensation of being full) include the arcuate nucleus of the hypothalamus (ARC, also abbreviated ARH), the dorsomedial hypothalamic nucleus (DMH or DMN), and the ventromedial hypothalamic nucleus (VMH or VMN) all of which are located in the tuberal medial area. The ARC is involved in control of feeding behavior as well as secretion of various pituitary releasing hormones, the DMH is involved in stimulating gastrointestinal activity, and the VMH is involved in satiety. Early experiments involving lesions in the hypothalamus demonstrated that the lateral hypothalamic area (LHA) is responsible for transmitting orexigenic signals (desire for food intake) and loss of this region results in starvation. The medial hypothalamic nuclei (VMH and to a lesser extent the DMH) are responsible for the sensations of satiety and lesions in these regions of the hypothalamus result in hyperphagia (excessive hunger) and obesity.
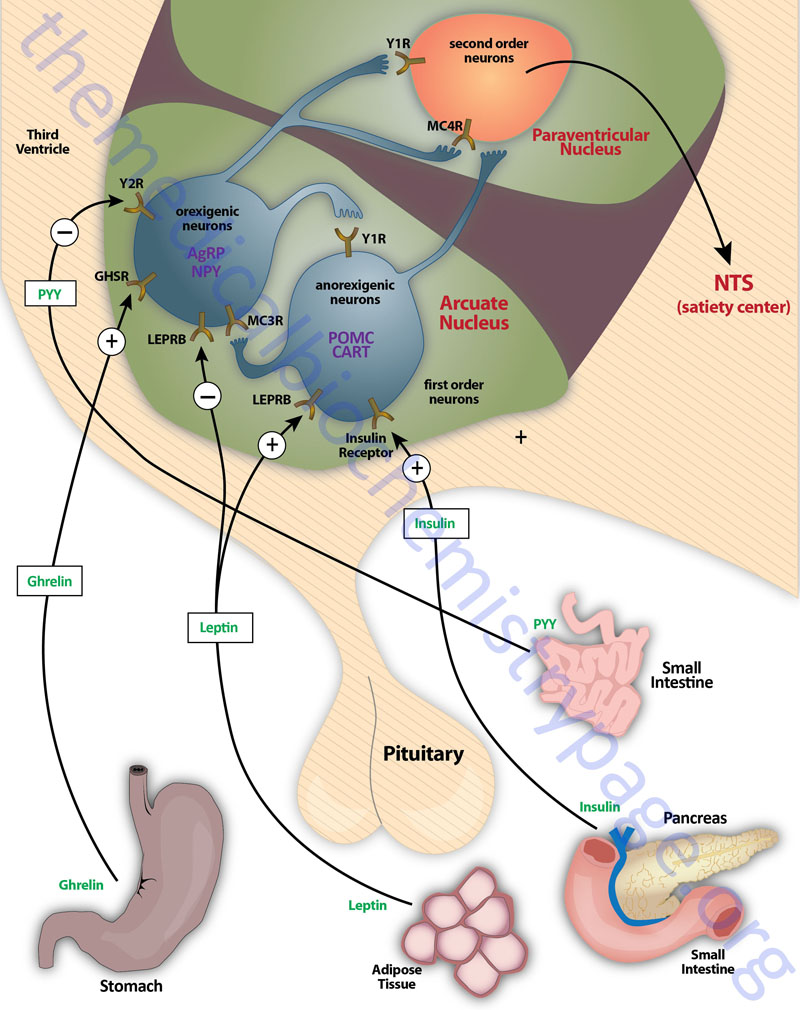
Appetite is a complex process that results from the integration of multiple signals at the hypothalamus. The hypothalamus receives neural signals, hormonal signals such as leptin, cholecystokinin (CCK: see below as well as link) and ghrelin and nutrient signals such as glucose, free fatty acids, amino acids and volatile fatty acids. This effect is processed by a specific sequence of neurotransmitters beginning within the ARC and orexigenic cells containing neuropeptide Y (NPY: see below as well as link) and Agouti-related peptide (AgRP) responsive neurons and anorexigenic cells containing pro-opiomelanocortin (POMC) (yielding the neurotransmitter α-MSH) and cocaine and amphetamine-regulated transcript (CART) responsive neurons. These so called first order neurons act on second order orexigenic neurons (containing either melanin concentrating hormone, MCH or the orexins) or act on anorexigenic neurons (expressing corticotropin releasing factor, CRF) to alter feed intake.
In addition, satiety signals from the liver and gastrointestinal tract signal through the vagus nerve to the nucleus of the solitary tract (NTS, for the Latin term nucleus tractus solitarii) to cause meal termination, and in combination with the hypothalamus, integrate the various signals to determine the feeding response. The activities of these neuronal pathways are also influenced by numerous factors such as nutrients, fasting and disease to modify appetite and hence impact on growth and reproduction.
The POMC-derived melanocortin peptides include α-MSH, β-MSH, γ-MSH, ACTH1-24, and ACTH1-13–NH2 (desacetyl-α-MSH). The POMC-derived melanocortins belong to a family of peptides referred to as the melanocortin system. This system includes the POMC-derived melanocotins which exhibit agonist activities, the antagonist peptide AgRP, the melanocortin receptors (MCR), and the melanocortin receptor accessory proteins (MRAPs). The MCR family of receptors consists of five identified members termed MC1R through MC5R.
The melanocortin system has been shown to be critical in the regulation of food intake and energy expenditure via a number of different assay systems involving both humans and animals. It is important to note that although β-MSH and γ-MSH are found to be produced in human brain they are not found in rodent brain or pituitary. However, when administered into the brain of animals the melanocortins α-MSH, β-MSH, and ACTH1-24 inhibit the intake of food. The actions of MSH peptides in feeding behavior is exerted primarily via peptide binding to the MC4R and to a lesser extent to the MC3R. Genetic mutations in humans as well as in animals that disrupt the expression and processing (this includes the proteases that process the POMC precursor) of POMC peptides and MCRs are associated with changes in energy balance and can lead to obesity and type 2 diabetes. In humans there have been mutations identified in the genes encoding proprotein convertase subtilisin/kexin type 1 (PCSK1; also referred to as prohormone convertase 1/3) and carboxypeptidase E (CPE), as well as in the α-MSH degrading enzyme prolylcarboxypeptidase (PRCP) that are associated with energy imbalance and a propensity for obesity. In mice a mutation in the CPE gene also results in the development of late-onset obesity. In genome-wide screens for gene polymorphisms associated with an increased risk of developing type 2 diabetes the MC4R gene was identified. Mutations in the MC4R gene are the most frequent causes of severe obesity in humans.
In mice ablation of the POMC gene (POMC-null) results in viable animals, even though they have minimal adrenal tissue and undetectable glucocorticoids due to the lack of ACTH. These animals develop obesity but do not become diabetic. Although not diabetic these mice do have a disruption in the regulation of glucagon secretion in response to experimental hypoglycemia. This indicates that POMC-derived peptides are involved in the regulation of glucagon. In humans a rare POMC-null mutation has been described. Unlike the situation in the POMC-null mice, humans with a lack of POMC expression are unable to survive without glucocorticoid supplementation from birth. Individuals that survive have red hair, dramatically increased desire for food intake, and high propensity for obesity. These conditions are the same as those seen in POMC-null mice. Another POMC mutation that has been identified in humans resulting in obesity is a point mutation in the cleavage site between β-MSH and β-endorphin. The consequences of this mutation suggests that β-MSH may be a significant endogenous anorectic agonist that activates the MC4R.
Neuropeptide Y, NPY
NPY is a hypothalamic neuroendocrine protein that is a member of a family of structurally related proteins identified as the pancreatic polypeptide (PP) family of hormones. In addition to NPY this family is composed of two gut hormones, pancreatic polypeptide (PP) and peptide tyrosine-tyrosine (PYY) both of which are discussed below. Each of these peptide hormones contains 36 amino acids consisting of numerous tyrosines (hence the Y peptides nomenclature) and an α-amidation at the C-terminus. The three-dimensional structure of these hormones includes a hairpin-like motif referred to as the pancreatic polypeptide fold (PP-fold). The PP-fold is required for interaction of the hormones with specific G-protein coupled receptors (GPCRs).
The PP family of proteins bind to a family of receptors that were originally characterized as NPY receptors. There are four NPY receptors in humans and they are designated as Y1, Y2, Y4, and Y5. An additional receptor identified as Y6 is found in mice and rabbits. Comparisons of the amino acid sequences of the four human Y receptors show that receptors Y1, Y4 are more closely related to each other than to the receptors Y2 and Y5. Receptors Y1, Y2, and Y5 preferentially bind NPY and PYY, whereas, Y4 exhibits highest affinity for PP. Although the Y5 receptor is expressed and binds ligand it is a truncated protein. The Y2 receptor is involved in anorexigenic responses (suppression of appetite) whereas the Y1 and Y5 receptors have been shown to induce orexigenic responses (stimulation of appetite). The Y2 receptors thus referred to as inhibitory receptors with respect to the activity of NPY and they are abundantly expressed on NPY neurons in the arcuate nucleus (ARC) of the hypothalamus.
NPY is expressed throughout the mammalian brain with highest levels found in the ARC of the hypothalamus. NPY is one of the most potent orexigenic factors produced by the human body. Within the ARC there are two neuronal populations that exert opposing actions on the desire for food intake. Neurons that co-express NPY and another neuropeptide called agouti-related peptide (AgRP) stimulate food intake, whereas, neurons that co-express POMC and cocaine and amphetamine-regulated transcript (CART) suppress the desire for food intake. The role of NPY in appetite control can be demonstrated by central administration of NPY which results in a markedly increased desire for food intake. The Y1 and Y5 receptors mediate the bulk of the effects of NPY on the hypothalamic-pituitary-thyroid axis. Within the ventromedial nucleus (VMN) of the hypothalamus, binding of NPY to the Y1 receptor results in inhibition of neuronal function (via hyperpolarization) which results in interference with the satiety role of the VMN. The majority of hypothalamic Y2 receptors are found on NPY-containing neurons. Conversely, Y2 receptor activation in the ARC results in inhibition of the actions of NPY which accounts for the anorexigenic actions associated with Y2 activation.
Of significance to dieting and weight loss is the fact that when people lose excess weight the level of NPY increases which likely is a contributing factor to the inability of most people to keep the weight off. This phenomenon has been demonstrated in mice fed a high-fat diet. These mice will become obese, have increased fat mass, and increased circulating levels of leptin. When the animals are placed on a calorie-restricted diet they lose the excess fat and leptin levels decline. However, the level of expression of the NPY gene is observed to be significantly increased. This and other data indicate that NPY is also one of the most important hypothalamic-derived neuropeptides mediating the effects of leptin on overall energy homeostasis. Whereas, losing excess weight is associated with increased expression of NPY, the levels of the anorexigenic peptides, POMC and CART, do not change.
Protein Tyrosine Tyrosine, PYY
PYY produced by and is secreted from intestinal enteroendocrine L-cells of the ileum and colon. Additional gut hormones that are secreted along with PYY include GLP-1 and oxyntomodulin (OXM). Both of these latter gut hormones are discussed above. Secreted forms of PYY include PYY1-36 and PYY3-36 with PYY3-36 being generated via the actions of dipeptidylpeptidase IV (DPP-4 or DPP-IV). DPP-4 is the same enzyme that inactivates GLP-1. Within the gastrointestinal tract the highest detectable levels PYY are found in the rectum with low levels found in the duodenum and jejunum. Within the central nervous system (CNS) PYY is detectable in the hypothalamus, medulla, pons, and spinal cord.
The release of PYY results in reduced gut motility, a delay in gastric emptying, and an inhibition of gallbladder contraction. All of these actions are, like that of PP, associated with the ileal brake. Given that PYY is secreted from cells of the distal gut there must be signals associated with the response of the proximal gut to food intake that lead to PYY release. Indeed humoral factors such as CCK and gastrin are thought to mediate the rapid release of PYY in response to eating. The amount of PYY released in response to the ingestion of food is proportional to the caloric intake. Animal and human studies of anorectic conditions indicate that PYY has a critical role in satiety. Within the CNS, PYY exerts its effects on satiety via actions in the hypothalamus, specifically the ARC of the hypothalamus. The ARC is in close proximity to the deficient blood-brain barrier of the median eminence of the hypothalamus, thus allowing this region to respond rapidly to the release of a gut hormone into the circulation. Evidence confirming the role of PYY in inducing anorexia has been obtained in mice by direct injection of the peptide into the ARC. Given the role of PYY in appetite suppression it is thought that disturbances in PYY release in response to food intake may play a role in the development of obesity. Indeed, in obese humans there is a blunted PYY response following food intake compared to lean humans. Current therapeutic interventions designed to combat obesity involve studies of the efficacy of PYY at suppressing appetite.
Oxyntomodulin, OXM
Oxyntomodulin (OXM) is so called given that is was originally discovered from work examining the inhibition of the activity of oxyntic glands (gastric acid secreting) of the stomach. OXM is a 37 amino acid peptide derived from the pre-pro-glucagon gene and contains the entire 29 amino acids of the pancreas-derived glucose regulating hormone glucagon. The OXM protein contains an additional 8 amino acids at its C-terminus relative to glucagon. Synthesis and release of OXM occurs in the enteroendocrine L cells of the distal gut. These are the same cell populations that secrete GLP-1 and PYY. The secretion of OXM occurs within 5-10 minutes following ingestion of food and peaks within 30 minutes. The amount of OXM that is released is directly proportional to caloric intake. In addition to stimulated release in response to food intake, OXM exhibits diurnal variation in its concentration in the blood with highest levels detected in the evening and lowest levels in the morning.
Thus far there has been no specific OXM receptor identified. Evidence suggests that the anorexigenic effects of OXM are in fact exerted via the GLP-1 receptor (GLP-1R). In mice in which the GLP-1R gene has been knocked out the anorectic responses to injected OXM are abolished. Like GLP-1, OXM has demonstrated incretin activity (incretins stimulate insulin release in response to food intake) and this activity is abolished in the GLP-1R knock-out mouse. In addition, OXM exerts a protective effect on pancreatic β-cells similar to that exerted by GLP-1. Although the affinity of OXM for the GLP-1R is at least 50 fold less than that of GLP-1 itself, the ability of OXM to exert inhibition of food intake is equal to that of GLP-1. With respect to effects on food intake exerted via the hypothalamus when either OXM or GLP-1 are administered peripherally they exert differential neuronal activation within the hypothalamus. This suggests that these two hormones act via different hypothalamic pathways involved in appetite control. When OXM is administered into the brain the response is suppression of the effects of circulating ghrelin. These results suggest that part of the appetite suppressing effects of OXM are mediated by reduced ghrelin as well as increased hypothalamic release of anorexigenic peptides.
Of potential significance to the treatment of obesity, when OXM is administered intravenously to human subjects there is an observed reduction (19.3%) in food intake at mealtime. Additionally significant is the fact that this reduction in desire for food intake persisted over the course of 12 hours. When OXM is administered subcutaneously to overweight and obese subjects over a period of 4 weeks there is a significant reduction in body weight. The average weight loss in the volunteers was 2.3kg (1 lb) compared to only 0.5kg in untreated control subjects. The weight loss observed in these studies was likely due to a combination of reduced desire for food intake as well as an increased metabolic expenditure. When OXM was administered over a 4 day period to human subjects there was an observed 10% increase in total energy expenditure. Although these results prove promising for the potential for OXM in the treatment of obesity it is important to note that OXM is a target for inactivation by DPP-4 just as is GLP-1. Therefore, any OXM agonist must be resistant to inactivation by DPP-4.
Cholecystokinin, CCK
Cholecystokinin (CCK) is derived via post-translational modification of the pro-cholecystokinin gene product. CCK was the first gut hormone to be identified as having an effect on appetite. There are several bioactive forms of CCK that are designated based upon the number of amino acids in the peptide. The four major forms are CCK-8, CCK-22, CCK-33, and CCK-58. The predominant form that is found in human plasma is the CCK-33 form. The CCK isoforms are also found as sulfated and non-sulfated variants. CCK is secreted from intestinal enteroendocrine I cells predominantly in the duodenum and jejunum. The level of CCK in the blood rises within 15 minutes of food ingestion and reaches a peak by 25 minutes. The elevation in plasma CCK levels remains for approximately 3 hours following a meal. The most potent substances initiating a release of CCK from the I cells are fats and proteins. Conversely duodenal bile acids are potent suppressors of the secretion of CCK.
CCK exerts its biological actions by binding to specific G-protein coupled receptors (GPCRs). There are two CCK receptor types identified as CCK-1 and CCK-2. The CCK receptors are also identified as CCKA and CCK whose designations referred to their location of prominent expression with CCKA referring to the alimentary tract (the gut) and CCKB referring to the brain. However, both receptors are found widely expressed in the CNS as well as the periphery.
Upon binding its receptors in the gut CCK induces contractions of the gallbladder and release of pancreatic enzymes and also inhibits gastric emptying. Within the brain (specifically the median eminence and ventromedial nucleus of the hypothalamus, VMH) CCK actions elicit behavioral responses and satiation. The CCK-1 receptor is believed to be the receptor primarily responsible for alterations in feeding behavior. Evidence for this comes from the Otsuka Long Evans Tokushima Fatty rat which has a null mutation in the CCK-1 receptor. These rats are hyperphagic and develop obesity even on a fat restricted diet. The situation is not entirely conclusive since knock-out of the CCK-1 receptor in mice does not result in a similar phenotype. However, the ability of CCK to regulate food intake has been clearly demonstrated in numerous studies. For example central administration of CCK results in reduced food intake. Of significance to appetite control, this effect is enhanced with co-administration of leptin. The synergistic effects of CCK and leptin may be due to the fact that their receptors are co-localized to the same sensory vagal afferent neurons.
In humans the correlations between CCK and obesity are growing. Studies have shown that the fasting levels of CCK are lower in morbidly obese individuals than in lean individuals. In addition, the post-feeding responses to CCK in morbidly obese individuals in attenuated compared to lean individuals. The primary appetite suppressing effects of CCK are exerted via its inhibitory actions on NPY neurons (orexigenic neurons) in the DMH and the NTS.
Using genome wide screens for polymorphisms in genes associated with obesity and/or increased feeding behaviors have shown a correlation to the CCK_H3 haplotype. Polymorphisms in the CCK-1 receptor gene may also predispose an individual to obesity. Although CCK is known to be involved in satiation it may have limited use as a therapeutic for the treatment of obesity at least when used alone. This is due to the fact that when studied in laboratory animals administration of CCK resulted in reduced meal size but the animals increased their frequency of food intake such that the overall outcome was no net change in body weight. However, given the synergistic actions of CCK and leptin combination therapies of these two hormones may prove useful.
Obesity and Cardiovascular Disease
Obesity is directly correlated to increased morbidity resulting primarily from hypertension and cardiovascular disease. However, since obesity is highly correlated to the development of type 2 diabetes, the pathophysiological complications associated with diabetes also contributes to obesity related mortality. Obesity is the result of excess accumulation of body fat including both cutaneous and visceral adipose tissue. As adipose tissue enlarges due to excess triglyceride accumulation physiological changes occur that result in increased inflammatory responses in the tissue. In addition to increased pro-inflammatory events in adipose tissue in response to excess lipid accumulation, so too do these same disruption occur in the liver. One consequence of the enhanced inflammatory status of the liver and adipose tissue in obesity is an associated insulin resistance (IR). For more information on the effects of obesity-induced IR in the liver see the section below and also see the discussion of IR in the Insulin Function, Insulin Resistance, and Food Intake Control of Secretion page.
Insulin resistance induced by obesity is a major factor in the development of cardiovascular disease in obese individuals. Within the vasculature insulin exerts vasodilator action as a result of increased nitric oxide (NO) production. This function of insulin is an important component of the ability of the hormone to enhance glucose uptake by skeletal muscle. The insulin-mediated signaling pathway that triggers production of NO in vascular endothelium involves the same signaling proteins, phosphatidylinositol-3-kinase (PI3K), PIP3-dependent protein kinase 1 (PDPK1), and protein kinase B/AK strain transforming (PKB/AKT), that are components of metabolic regulatory pathways induced by insulin. PKB/AKT was originally identified as the tumor inducing gene in the AKT8 retrovirus found in the AKR strain of mice. Humans express three genes in the AKT family identified as AKT1 (PKBα), AKT2 (PKBβ), and AKT3 (PKBγ). Inactivation of endothelial cell NO production, as occurs due to IR, results in endothelial dysfunction and promotes the development of atherosclerosis.
Atherosclerosis is in essence a pro-inflammatory condition where there is enhanced leukocyte infiltration into the vascular endothelium and an associated increase in secretion of pro-inflammatory cytokines which sets up a feed-forward process that builds upon itself. One of the principal pro-inflammatory cytokines whose expression is increased in obesity, and plays a critical role in the development of atherosclerosis, is tumor necrosis factor-α (TNFα). Expanding adipose tissue secrete ever increasing amounts of TNFα as well as other proatherogenic factors such as plasminogen activator inhibitor type 1 (PAI-1). Increased circulating TNFα results in enhanced adhesion of leukocytes to the endothelium. Adherent monocytes infiltrate the endothelial layer of the vasculature where they phagocytose the excess lipoprotein particles in the vasculature and become foam cells. Foam cell secretion of cytokines activates the underlying smooth muscle cells (SMCs) to proliferate and migrate. As SMCs proliferate they increase production of extracellular matrix which leads to decreased fluidity (“hardening”) of the vasculature. The increased levels of PAI-1 inhibit the ability of plasminogen to be converted to plasmin which is required to dissolve fibrin clots that will be generated as a result of the local inflammatory processes. As the disease progresses atherosclerotic plaque formation occurs and expands. Plaques can become large enough to result in vessel occlusion or to the release of a fibrous clot which can travel to the heart of lungs leading to fatal embolisms.
Metabolic Dysfunction-Associated Fatty Liver Disease (MAFLD)
Metabolic dysfunction-associated fatty liver disease (MAFLD), also known as metabolic dysfunction-associated steatotic liver disease (MASLD) and formerly referred to as non-alcoholic fatty liver disease (NAFLD), is the most common liver disease in the Western world. MAFLD is characterized by fatty infiltration of the liver in the absence of alcohol consumption, genetic diseases that affect the liver, hepatotoxic medications, viral infections, and toxins. The designation of MAFLD is, therefore, an exclusion diagnosis. For information on the role of alcohol consumption and the formation of the fatty liver syndrome visit the Ethanol (Alcohol) Metabolism: Acute and Chronic Toxicities page.
In 2020, researchers studying NAFLD made a decision that, given the metabolic disruptions that underlie the development of NAFLD, a more appropriate nomenclature would be metabolic dysfunction-associated fatty liver disease (MAFLD). Therefore, this acronym will be used for describing the causes and development of this type of liver disease. Currently, MAFLD is defined by the presence of hepatic steatosis in conjunction with at least one of three conditions: obesity, type 2 diabetes, or metabolic dysregulation.
The mildest forms of MAFLD consists of simple steatosis (abnormal retention of lipids inside cells) and can progress to non-alcoholic steatohepatitis (NASH) which represents a deleterious hepatic inflammatory disorder characterized by advanced liver fibrosis and cirrhosis which ultimately can result in hepatocellular carcinoma and death. The current approved nomenclature for NASH is metabolic dysfunction-associated steatohepatitis (MASH).
In the clinical environment, MAFLD is believed to account for as much as 90% of all cases of elevated liver function test enzymes in patients who do not manifest with identifiable causes of hepatic disease (e.g. viral hepatitis).
The abnormal deposition of fat in the liver in MAFLD comprises a complex pathophysiology. However, what is known about the process is that there is increased visceral adiposity plus insulin resistance with increased free fatty acids (FFA) being released from adipose tissue. As there is a large increase in visceral adipose tissue in obese individuals this contribution of adipose tissue derived FFA is significant to the development of MAFLD. These conditions set the stage for the onset and perpetuation of the steatosis in the liver. Additional pathophysiology includes an enhanced state of hepatic oxidative stress and lipid peroxidation, decreased antioxidant defenses, early mitochondrial dysfunction, and iron accumulation. Associated with these abnormal hepatic processes are an imbalance in the secretion of adipokines and a chronic pro-inflammatory status. In addition, gut-derived microbial adducts participate in the propagation of the hepatic dysfunction (see section below on role of gut bacteria in obesity).
One of the most significant contributing factors to the development of MAFLD is insulin resistance in the liver. For more information on the causes of insulin resistance visit the Insulin Function, Insulin Resistance, and Food Intake Control of Secretion page. Insulin resistance (IR) in the liver is associated with increased hepatic glucose output since the insulin-suppressing effects on gluconeogenesis are impaired. The increased hepatic glucose output exacerbates the hyperglycemia that is present in obesity and contributes to the IR in the periphery ultimately resulting in progression to type 2 diabetes. Peripheral IR at the level of adipose tissue and skeletal muscle results in increased circulating FFA which make their way to the liver. In addition, the hepatic IR results in increased hepatic fatty acid synthesis which then, in conjunction with the circulating FFA, serves as the precursors for increased triglyceride accumulation in the liver.
Hepatic IR is induced by the excess accumulation of FFA. Within the hepatocyte metabolites of the FFA re-esterification process, including long-chain acyl-CoAs and diacylglycerol (DAG), accumulate. Excess FFAs also participate in the relocation of several protein kinase C (PKC) isoforms, from the cytosol to the membrane compartment. These PKC isoforms include PKC-β2, PKC-δ, and PKC-theta (PKC-θ). DAG is a potent activator of these PKC isoforms and the membrane-associated PKC will phosphorylate the intracellular portion of the insulin receptor on serine residues which results in impairment of insulin receptor interaction with downstream signaling proteins including insulin receptor substrate 1 (IRS1) and IRS2. Loss of IRS1 and IRS2 interaction with the insulin receptor prevents interaction with phosphatidylinositol 3-kinase (PI3K) and its subsequent activation. For more information on insulin receptor signaling pathways visit the Insulin Function, Insulin Resistance, and Food Intake Control of Secretion page. In addition to serine phosphorylation of the insulin receptor, various PKCs have been shown to phosphorylate IRS1 and IRS2 further impairing the ability of these insulin receptor substrates to associate with the insulin receptor.
The FFA-induced down-regulation of insulin signaling pathways results in activation of several kinases involved in stress responses. These kinases include Jun N-terminal kinase (JNK), inhibitor of nuclear factor kappa B kinase beta (IKKβ), and suppressor of cytokine signaling-3 (SOCS-3). Like PKC, JNK activity is also regulated by FFA and is an important contributor to IR. The target of JNK action is the Ser307 of IRS1 and this phosphorylation plays an important role in the progression to hepatic IR. Activation of IKKβ (which is required for the activation of nuclear factor kappa B, NF-κB) may have the most pronounced effect on inflammatory responses in the lever. NF-κB is the most important transcription factor activating the expression of numerous pro-inflammatory cytokine genes such as interleukin-1 (IL-1), IL-6, and TNFα, each of which have been shown to be involved in promoting IR. NF-κB-dependent inflammatory mediators produced in hepatocytes act to reduce insulin sensitivity and to promote liver injury.
The loss of insulin-mediated repression of hepatic gluconeogenesis (leading to increased hepatic glucose output) is due to the inability of the transcription factor, forkhead box-containing protein O subfamily-1 (FOXO1), from being taken up by the nucleus. FOXO1 regulates the expression of the catalytic subunit of glucose-6-phosphatase (G6PC) and phosphoenolpyruvate carboxykinase (PEPCK). The activation of these gluconeogenesis genes by FOXO1 requires an association with peroxisome proliferator-activated receptor-gamma co-activator 1 alpha (PGC-1α) and possibly also with CAAAT/enhancer-binding protein-alpha (C/EBPα). Normally the expression of C/EBPα is down-regulated by insulin via induction of the inhibitory isoform of C/EBPβ which was originally identified as liver-enriched inhibitory protein (LIP).
Altered lipogenesis that occurs in the presence of hepatic and peripheral IR also contribute to the development of MAFLD. The primary regulators of hepatic lipogenesis include sterol regulated element-binding protein-1c (SREBP-1c), carbohydrate response element-binding protein (ChREBP), and peroxisome proliferator-activated receptor-gamma (PPARγ).
As indicated above, hepatic IR results in increased expression of SOCS-3 which in turn results in a significant upregulation of SREBP-1c expression. The increased SREBP-1c levels activate the acetyl-CoA carboxylase-2 (ACC2) gene which encodes the isoform of ACC that produces malonyl-CoA at the mitochondrial membrane. The increase in malonyl-CoA at the mitochondrial membrane causes an inhibition of carnitine palmitoyl transferase-1 (CPT-1) which transports fatty acids into the mitochondria for oxidation. Thus, inhibited CPT-1 results in decreased oxidation of fatty acids further increasing the pool of FFAs in the hepatocyte.
Increased activity of SREBP-1c results in increased expression of PPARγ due to the production of an activating ligand for this transcription factor. Genes regulated by PPARγ, that are involved in lipid metabolism or glucose homeostasis, include lipoprotein lipase (LPL), acetyl-CoA acetyltransferase (ACAT1), several phospholipase A (PLA) genes, PEPCK, and glycerol-3-phosphate dehydrogenase 1 (GPD1).
The increased hepatic glucose production results in activation of ChREBP and a consequent activation of its target genes that includes ACC, fatty acid synthase (FAS), and liver-type pyruvate kinase (L-PK). The activation of these genes leads to increased de novo synthesis of fatty acids. L-PK activation results in diversion of some of the excess glucose into pyruvate and ultimately to acetyl-CoA via the pyruvate dehydrogenase complex (PDHc), and this acetyl-CoA is in excess of the ability of liver mitochondria to oxidize in the TCA cycle thus, increasing the substrate pool for fatty acid synthesis. In addition, ChREBP regulates the expression of glycerol 3-phosphate acyltransferases. Humans express four glycerol-3-phosphate acyltransferase genes, each of which is involved in the esterification of glycerol-3-phosphate generating various lysophosphatidic acids. These reactions represent the first step in the synthesis of triglycerides (TG or TAG).
Whereas the development of hepatic IR is the first dysfunction contributing to the progression to MAFLD, the contribution of impaired fatty acid and complex lipid metabolism stems from the oxidative stress that is induced. Under the conditions of excess fat accumulation there is an increase in the production of reactive oxygen species (ROS) in the liver. The increased ROS production is due to a combination of mitochondrial and peroxisomal lipid oxidation. In addition, mechanisms involving cytochrome P450, nicotinamide adenine dinucleotide oxidase, cyclooxygenase, and lipoxygenase participate in increased ROS production and reduced hepatic antioxidant synthesis.
One mechanism resulting in reduced hepatic antioxidant production is a defect in mitochondrial uptake of glutathione (GSH). Increased hepatocyte lipid content leads to increased lipid peroxidation reactions that can result in gross morphological alterations in mitochondria and an associated impairment of electron transport. These changes result in increased TNFα expression which leads to enhanced lipid peroxidation which then exacerbates the mitochondrial dysfunction. In addition to increased TNFα production, lipid peroxidation induces the expression of other pro-inflammatory cytokines such as IL-8 and transforming growth factor-β (TGF-β). IL-8 is a chemoattractant that promotes neutrophil infiltration into the liver and TGF-β is known to promote hepatic fibrosis via induction of collagen production.
Mitochondrial Dysfunction in Obesity and Type 2 Diabetes
Well established data demonstrate that mitochondrial dysfunction, particularly as it relates to the processes of oxidative phosphorylation, is contributory to the development of encephalomyopathy, mitochondrial myopathy, and several age-related disorders that include neurodegenerative diseases, the metabolic syndrome, and diabetes. Indeed, with respect to diabetes, several mitochondrial diseases manifest with diabetic complications such as mitochondrial myopathy, encephalopathy, lactic acidosis, and stroke-like episodes (MELAS) and maternally inherited diabetes and deafness (MIDD).
Normal biogenesis of mitochondria is triggered in response to changes in the ATP/ADP ratio and to activation of AMPK which in turn results in increased expression of PPARγ co-activator 1α (PGC-1α) and nuclear respiratory factor-1 (NRF1). PGC-1α is a master transcriptional co-activator of numerous genes involved in mitochondrial biogenesis. NRF1 is a transcription factor that regulates the expression of mitochondrial transcription factor A (TFAM, for transcriptionfactor A, mitochondrial; also designated mtTFA) which is a nuclear transcription factor essential for replication, maintenance, and transcription of mitochondrial DNA. NRF1 also controls the expression of nuclear genes required for mitochondrial respiration and heme biosynthesis. Evidence has shown that both PGC-1α and NRF1 expression levels are lower in diabetic patients and in non-diabetic subjects from families with type 2 diabetes. The expression of NRF1 is highest in skeletal muscle which is also the tissue that accounts for the largest percentage of glucose disposal in the body and, therefore, is the tissue that is most responsible for the hyperglycemia resulting from impaired insulin signaling.
Mitochondrial dysfunction results in increased production of ROS which activates stress responses leading to increased activity of MAPK and JNK. Both of these serine/threonine kinases phosphorylate IRS1 and IRS2 resulting in decreased signaling downstream of the insulin receptor. Inhibited IRS1 and IRS2 activity results in decreased activation of PI3K. PI3K activation is involved in the translocation of GLUT4 to the plasma membrane resulting in increased glucose uptake. Therefore, inhibition of PI3K results in reduced glucose uptake in skeletal muscle and adipose tissue. Mitochondrial dysfunction results in a reduction in the level of enzymes involved in β-oxidation leading to increases in intramyocellular lipid content. Indeed, skeletal muscle metabolism of lipids has been shown to be impaired in type 2 diabetics. An increased delivery of fatty acids to skeletal muscle, as well as diminished mitochondrial oxidation, results in increased intracellular content of fatty acid metabolites such as diacylglycerol (DAG), fatty acyl-CoAs, and ceramides. These metabolites of fatty acids are all known to induce the activity of protein kinase C isoforms (PKCβ and PKCδ) that phosphorylate IRS1 and IRS2 on serine residues resulting in impaired insulin signaling downstream of the insulin receptor.
Given that impaired mitochondrial function is clearly associated with obesity and type 2 diabetes, it is not surprising that there is great interest in the use of pharmacology to augment mitochondrial function in the treatment of these disorders. Of significance is the fact that the thiazolidinedione (TZD) class of drugs used to treat the hyperglycemia of type 2 diabetes (see the next section) activate PPARγ which in turn increases the level of activity of PGC-1α. Although the TZDs were first marketed due to their ability to improve insulin sensitivity, they have since been shown to increase mitochondrial functions both in vitro and in vivo.
Antioxidants have also been shown to enhance mitochondrial function by reducing the production of ROS. Resveratrol (found in grape skins and red wine) is a potent antioxidant whose activity is, in part, due to its ability to activate the deacetylase SIRT1. Activated SIRT1 deacetylates PGC-1α resulting in increased transcriptional activity and thus, enhanced mitochondrial biogenesis.
Obesity-Mediated Mitochondrial Dysfunction in Adipose Tissue
Because skeletal muscle can remove the largest amount of serum glucose in response to insulin, mitochondrial dysfunction in this tissue will have the greatest impact on glucose disposal. However, adipose tissue also plays an important role in glucose homeostasis and mitochondrial dysfunction in this tissue has been shown to result in impaired glucose homeostasis resulting in diabetes. For example, when animals are treated with inhibitors of mitochondrial oxidation insulin-stimulated glucose uptake in adipose tissue is significantly impaired.
Adipose tissue secretes a number of proteins classified as adipokines. Adiponectin is an adipokine that promotes insulin-sensitivity in insulin-responsive tissues, such as skeletal muscle. When plasma levels of adiponectin are measured in obese or type 2 diabetic subjects they are found to be significantly lower than in age and sex matched control subjects that are of normal weight or that do not have diabetes. In animal studies, the enhancement of adipocyte mitochondrial biogenesis results in increased adiponectin release from adipose tissue. Conversely, expression of adiponectin expression is decreased in adipocytes with mitochondrial dysfunction.
Recent evidence has shown that a monomeric G-protein of the RAS family, specifically RalA, plays a significant role in the mitochondrial dysfunction that is prevalent in obesity. Expression of the gene (RALA; RAS like proto-oncogene A) encoding the RalA protein, as well as the activity of RalA, are both increased in white adipose tissue under conditions of high fat diet-induced obesity.
Under conditions of normal diet, when insulin activates its receptor in white adipocytes, RalA activity is enhanced. Following insulin activation, RalA participates in the mobilization of membrane vesicles containing GLUT4 to the plasma membrane. The activation of RalA by insulin results as a consequence of the phosphorylation and inhibition of the the GTPase activating complex (RalGAP) that normally serves to reduce the activity of RalA. In addition, insulin enhances the localization of the guanine nucleotide exchange factor (GEF) for RalA (Ral guanine nucleotide dissociation stimulator like 2; encoded by the RGL2 gene) to the RalA complex allowing for enhanced recycling of GTP for GDP, keeping RalA active. However, under conditions of high fat diets, the activity of RalA becomes contributory to obesity.
In mice, the targeted deletion of RalA in white adipocytes results in the attenuation of high fat diet-induced obesity. This effect is the result of increased mitochondrial fatty acid oxidation. Under conditions of a high fat diet there is an increase in mitochondrial fission in white adipocytes. RalA is involved in this process through its interaction with, and activation of, the phosphatase, PP2A.
With respect to mitochondrial biogenesis, the activity of PP2A leads to the removal of an inhibitory phosphorylation the protein encoded by the DNM1L gene. The DNM1L encoded protein is dynamin-related protein 1 (Drp1). The Drpl1 protein function in both mitochondrial fission and peroxisomal fission. PKA-mediated phosphorylation of Drp1 at Ser 637 interferes with its translocation to mitochondrial fission sites and promotes Drp1 detachment from the mitochondrion. This inhibitory phosphorylation is the target for PP2A. Therefore, the activation of PP2A by RalA results in an increase in mitochondrial fission and ultimately mitochondrial fragmentation.
Role of Gut Bacteria in Obesity
In trying to understand the epidemic of obesity much of the research has focused on two critical areas. The first is research driven by the notion that the biological and physiological interrelationships of the organ systems, primarily liver, adipose tissue, and skeletal muscle, are tightly connected and any disruption in the metabolic profile of one organ can exert a negative impact on the others. An additional avenue of more recent research is the use of modern genetic tools to scan the human genome for polymorphisms that are associated with increased risks for obesity and diabetes. However, a new area of study has begun to focus on the role of the bacterial complement (microbiota) of the gut and the role these microorganisms play in altering dietary and metabolic processes.
The idea that gut bacteria can influence overall metabolism was discovered in studies using germ free mice. Mice raised in a germ free environment are resistant to diet-induced obesity. The primary mechanisms underlying this resistance are decreased absorption of glucose, decreased generation of short-chain fatty acids in the gut, reductions in hepatic lipogenesis, and alterations in adipose tissue metabolism that favors reduced triglyceride accumulation and increased fatty acid oxidation. A number of striking observations have been made in the use of animal models for studying the interaction between gut bacteria and diet-induced obesity and the development of insulin resistance and type 2 diabetes. When the guts of mice reared in a germ-free environment are colonized with bacteria from mice raised in a non-sterile environment the germ free mice amass a 60% increase in body weight and this weight gain is associated with insulin resistance. Another important observation was made when comparing the source of the bacteria to be used for gut colonization. If bacteria are used from obese mice (the ob/ob genotype) the recipient mice have a significantly greater increase in body fat mass than in recipients that were colonized with bacteria from lean mice.
The mechanism of the weight gain in these study mice was due to increased digestion of polysaccharides resulting in higher absorption and delivery of sugars to the liver. The increased carbohydrate delivery to the liver results in increased lipogenesis. When the transcriptional profiles of the livers were analyzed it was found that germ-free mice colonized with bacteria from ob/ob mice had increased levels of expression of ChREBP and SREBP-1c, both of which drive increased fatty acid synthesis via activation of the expression of ACC and FAS. Although the re-colonized mice had increased fat deposition in the liver via the described transcriptional changes, the increase in adipose tissue mass was determined to be due to increases in the activity of lipoprotein lipase (LPL). LPL is present on the surface of vascular endothelial cells of the capillaries of adipose tissue, skeletal, and cardiac muscle and has a central role in lipoprotein metabolism.
During periods of fasting, the expression of a protein called fasting-induced adipose factor (FIAF) is stimulated by PPARα in liver and by PPARγ in white adipose tissue. FIAF is encoded by the ANGPTL4 gene (angiopoietin-like 4). FIAF inhibits adipose tissue LPL activity by acting extracellularly as an unfolding molecular chaperone. The N-terminal coiled-coil domain of FIAF transiently binds to LPL and this interaction converts LPL from a catalytically active dimer to an inactive monomer. In the re-colonized germ-free mice the level of FIAF expression was significantly reduced allowing for increased uptake of fatty acids from circulating lipoproteins and a concomitant increase in adipose tissue triglyceride storage. These changes in lipid profiles in the liver and adipose tissue of obese bacteria re-colonized rodents was correlated to changes in the composition of gut microbiota such that there was a 50% reduction in the abundance of Bacteriodetes and a proportional increase in Firmicutes.
The intestinal epithelium is the largest immunologically active organ system in the human body. This tissue provides defense of the host from invading pathogens. However, given that the microorganisms of the gut are essential for the metabolism of xenobiotic compounds, production of vitamins, degradation of non-digestible polysaccharides (involving fermentation of resistant starches and oligosaccharides), and absorption of nutrients, there is a fine interplay between the gut immune system surveillance and maintenance of the gut microbiota.
The human gut contains a wide variety of microorganisms of which bacteria constitute the largest fraction. The average human gut contains some 1014 bacteria of which anaerobic bacteria constitutes the largest proportion. There are anywhere from 500 to 1000 different species of bacteria in the gut population divided into three bacterial phyla: Bacteroidetes (gram-negative), Actinobacteria (gram-positive), and Firmicutes (gram-positive). The Firmicutes consist of over 200 genera which includes Bacillus, Clostridium, Lactobacillus, and Mycoplasma. Of significance to the relationship between gut microbiota and obesity, studies have shown that obese individuals had lower levels of Bacteroidetes and more Firmicutes than lean control subjects. When obese patients are placed on either a carbohydrate restricted low calorie diet or a fat restricted diet their ratios of Bacteroidetes to Firmicutes approached those of lean control subjects after several months.
Bacteria of the Bacteroidetes phylum constitute up to 30% of the total gut flora. These bacteria are important in the digestion of otherwise non-digestible polysaccharides into monosaccharides and short-chain fatty acids (SCFA) and also may be involved in the synthesis of vitamin K. The bacterial digestion of polysaccharides into SCFA involves a process called saccharolytic fermentation. The primary SCFA are acetic acid, propionic acid, and butyric acid. SCFA affect the growth and proliferation of intestinal epithelial cells through a signal transduction process that involves binding to a G-protein coupled receptor identified as GPR41.
Following absorption, propionic acid aids the liver in the production of ATP by being converted to propionyl-CoA and then propionyl-CoA is converted to succinyl-CoA followed by oxidation in the TCA cycle. Butyrate promotes colonocyte cell differentiation, suppresses colonic inflammation, and of clinical significance it induces cell cycle arrest and apoptosis in colon cancer cells. These beneficial effects of butyrate (and also shown for propionate), within the colon are mediated, in part, by its ability to inhibit the activity of histone deacetylases (HDAC). Like butyrate, the ketone, β-hydroxybutyrate, has also been shown to inhibit the activity of HDAC. The effects of β-hydroxybutyrate-mediated HDAC inhibition are enhanced expression of genes that reduce the level of oxidative stress. In addition to altering the patterns of gene expression through modification of HDAC activity, β-hydroxybutyrate can alter gene expression patterns by serving as a direct modifier of lysine residues in histones resulting in lysine β-hydroxybutyrylation. The effects histone β-hydroxybutyrylation on gene expression represents a novel form of epigenetic control.
Given that obesity, insulin resistance, and type 2 diabetes are all associated with low-grade systemic inflammation of unclear etiology, it has been proposed that one mechanism leading to this state involves inflammatory modulation by gut bacteria. High-fat diet-induced obesity has been shown to be correlated with the increased expression of several pro-inflammatory cytokines including interleukin-1 (IL-1), IL-6, monocyte chemoattractant protein-1 (MCP-1), and tumor necrosis factor-alpha (TNFα). In particular, TNFα is known to cause insulin resistance, as described above in the MAFLD section (also see the Insulin Function, Insulin Resistance, and Food Intake Control of Secretion page).
Bacterial lipopolysaccharide (LPS) evokes an inflammatory response triggering the secretion of many of these same pro-inflammatory cytokines. LPS is continuously produced by gut bacteria through the lysis of dead and dying gram-negative bacteria. LPS binds to a complex of CD14 and the toll-like receptor 4 (TLR4) on cells of the innate immune system resulting in the secretion of these cytokines. LPS is also transported from the gut to peripheral tissues via interaction with chylomicrons. Since the rate of chylomicron synthesis is elevated in response to a high-fat and/or high-carbohydrate diet, there will be more LPS uptake in obese individuals due to the elevated intake of lipids and carbohydrates. The fat-induced increase in LPS uptake is referred to as metabolic endotoxemia. The role of a high-fat diet in triggering metabolic endotoxemia can be mimicked in the absence of dietary fat by direct infusion of LPS. When these experiments are carried out in mice fed a fat-restricted diet, LPS infusion resulted in fasting hyperglycemia, obesity, steatosis, infiltration of macrophages into adipose tissue, insulin resistance, and hyperinsulinemia, the same conditions found in high-fat diet fed mice.
Gut bacteria have also been shown to play a role in the secretion of gastrointestinal hormones that function in digestion and appetite control. One very important gut hormone is glucagon-like peptide-1 (GLP-1). GLP-1 is called an incretin which is a term referring to a substance that promotes pancreatic insulin secretion in response to food intake. For detailed information on GLP-1 see the Gut-Brain Interrelationships page. The role of GLP-1 in the regulation of digestion, insulin secretion, and appetite is precisely the reason it is a current pharmaceutical target in the treatment of hyperglycemia and type 2 diabetes. GLP-1 is secreted from specialized enteroendocrine cells (L-cells) of the ileum and colon and the composition of the diet affects the release of this hormone.
High fat and glucose content stimulate GLP-1 release but proteins do not appear to be involved in its secretion. When animals are fed a high fiber diet composed of non-digestible oligofructose, which can be fermented by gut bacteria, there is an increase in GLP-1 release. Oligofructose is called a prebiotic which is any substance that is non-digestible by humans but can be fermented by gut bacteria thereby promoting their growth and activity. In addition, feeding animals oligofructose results in increased L-cell proliferation in the proximal colon and this contributes to a higher level of GLP-1 release. When rats are fed a high-fat diet which also includes oligofructose there is an improvement in the diabetes induced by the high-fat diet alone. In humans, the consumption of oligofructose protects against weight gain, reduces fat accumulation, reduces serum triglyceride accumulation, and promotes satiety. These effects are presumably due, in part, to changes in the composition of gut microbiota as is seen in experimental animals.
Is There a Viral Link to Obesity?
A potential link between obesity and viral infection was initially suggested from studies that demonstrated increased body weight, increased glucose uptake, and decreased leptin secretion in animals infected with adenovirus-36 (Ad-36). Subsequently other viruses such as canine distemper, Rous-associated virus 7, scrapie, Borna disease virus, SMAM-1, as well as other adenoviruses were correlated to increasing obesity in animal models. Ad-36 is a virus that primarily infects humans and studies have shown that 30% of obese individuals (compared to only 11% of lean subjects) have circulating antibodies to Ad-36. The precise mechanism by which Ad-36 infection might lead to obesity is unknown.
Unlike in animal studies where canine distemper virus and Borna disease virus particles were found in the hypothalamus of obese animals, Ad-36 particles are not found in the hypothalamus of obese human subjects positive for Ad-36 antibodies. However, Ad-36 viral particles have been found in adipocytes and Ad-36 infection increases adipocyte differentiation from pre-adipocytes. It is also possible that adenoviral infection leads to increased inflammatory responses in adipose tissue, and possibly also the liver, that in turn leads to the metabolic disruptions seen to be typical of the pro-inflammatory state associated with, and resulting in, obesity.
Although the current evidence is suggestive of a link between viral infection and obesity the data are not conclusive nor of large enough numbers to clearly demonstrate a causal association to obesity. As more epidemiological data is collected viral infection may indeed be added to the list of known factors in the multifactorial model of the causes of obesity.