

Last Updated: May 26, 2026
Introduction to Enzymes
Enzymes are biological catalysts responsible for supporting almost all of the chemical reactions that maintain animal homeostasis. Because of their role in maintaining life processes, the assay and pharmacological regulation of enzymes have become key elements in clinical diagnosis and therapeutics. The macromolecular components of almost all enzymes are composed of protein, except for a class of RNA catalysts known as ribozymes. The term ribozyme is derived from ribonucleic acid enzyme. Most of the characterized ribozymes are molecules of ribonucleic acid that catalyze reactions on one of their own phosphodiester bonds or within other RNAs. In addition, there are known ribozymes that catalyze reactions on proteins, the best example being the peptidyltransferase activity of the large ribosomal subunit of protein synthesis.
Enzymes are found in all tissues and fluids of the body. Intracellular enzymes catalyze the reactions of metabolic pathways. Plasma membrane enzymes regulate catalysis within cells in response to extracellular signals, and enzymes of the circulatory system are responsible for regulating the clotting of blood. Almost every significant life process is dependent on enzyme activity.
Enzyme Classifications
Traditionally, enzymes were simply assigned names by the investigator who discovered the enzyme. As knowledge expanded, systems of enzyme classification became more comprehensive and complex. Currently enzymes are grouped into six functional classes by the International Union of Biochemists (I.U.B.).
| Number | Classification | Biochemical Properties |
| 1 | Oxidoreductases | Act on many chemical groupings to add or remove hydrogen atoms. |
| 2 | Transferases | Transfer functional groups between donor and acceptor molecules. Kinases are specialized transferases that regulate metabolism by transferring phosphate from ATP to other molecules. |
| 3 | Hydrolases | Add water across a bond, hydrolyzing it. |
| 4 | Lyases | Add water, ammonia or carbon dioxide across double bonds, or remove these elements to produce double bonds. |
| 5 | Isomerases | Carry out many kinds of isomerization: L to D isomerizations, mutase reactions (shifts of chemical groups) and others. |
| 6 | Ligases | Catalyze reactions in which two chemical groups are joined (or ligated) with the use of energy from ATP. |
These rules give each enzyme a unique number. The I.U.B. system also specifies a textual name for each enzyme. The enzyme’s name is comprised of the names of the substrate(s), the product(s) and the enzyme’s functional class. Because many enzymes, such as alcohol dehydrogenase, are widely known in the scientific community by their common names, the change to I.U.B.-approved nomenclature has been slow. In everyday usage, most enzymes are still called by their common name.
Enzymes are also classified on the basis of their composition. Enzymes composed wholly of protein are known as simple enzymes in contrast to complex enzymes, which are composed of protein plus a relatively small organic molecule. Complex enzymes are also known as holoenzymes. In this terminology the protein component is known as the apoenzyme, while the non-protein component is known as the coenzyme or prosthetic group where prosthetic group describes a complex in which the small organic molecule is bound to the apoenzyme by covalent bonds; when the binding between the apoenzyme and non-protein components is non-covalent, the small organic molecule is called a coenzyme. Many prosthetic groups and coenzymes are water-soluble derivatives of vitamins. It should be noted that the main clinical symptoms of dietary vitamin insufficiency generally arise from the malfunction of enzymes, which lack sufficient cofactors derived from vitamins to maintain homeostasis.
The non-protein component of an enzyme may be as simple as a metal ion or as complex as a small non-protein organic molecule. Enzymes that require a metal in their composition are known as metalloenzymes if they bind and retain their metal atom(s) under all conditions with very high affinity. Those which have a lower affinity for metal ion, but still require the metal ion for activity, are known as metal-activated enzymes.
Role of Coenzymes
The functional role of coenzymes is to act as transporters of chemical groups from one reactant to another. The chemical groups carried can be as simple as the hydride ion (H+ + 2e–) carried by NAD or the mole of hydrogen carried by FAD; or they can be even more complex than the amine (–NH2) carried by pyridoxal phosphate.
Since coenzymes are chemically changed as a consequence of enzyme action, it is often useful to consider coenzymes to be a special class of substrates, or second substrates, which are common to many different holoenzymes. In all cases, the coenzymes donate the carried chemical grouping to an acceptor molecule and are thus regenerated to their original form. This regeneration of coenzyme and holoenzyme fulfills the definition of an enzyme as a chemical catalyst, since (unlike the usual substrates, which are used up during the course of a reaction) coenzymes are generally regenerated.
Enzyme Relative to Substrate Type
Although enzymes are highly specific for the kind of reaction they catalyze, the same is not always true of substrates they attack. For example, while succinate dehydrogenase (SDH) always catalyzes an oxidation-reduction reaction and its substrate is invariably succinic acid, alcohol dehydrogenase (ADH) always catalyzes oxidation-reduction reactions but attacks a number of different alcohols, ranging from methanol to butanol. Generally, enzymes having broad substrate specificity are most active against one particular substrate. In the case of ADH, ethanol is the preferred substrate.
Enzymes also are generally specific for a particular steric configuration (optical isomer) of a substrate. Enzymes that attack D sugars will not attack the corresponding L isomer. Enzymes that act on L amino acids will not employ the corresponding D optical isomer as a substrate. The enzymes known as racemases provide a striking exception to these generalities; in fact, the role of racemases is to convert D isomers to L isomers and vice versa. Thus, racemases attack both D and L forms of their substrate.
As enzymes have a more or less broad range of substrate specificity, it follows that a given substrate may be acted on by a number of different enzymes, each of which uses the same substrate(s) and produces the same product(s). The individual members of a set of enzymes sharing such characteristics are known as isozymes. These are the products of genes that vary only slightly; often, various isozymes of a group are expressed in different tissues of the body. The best studied set of isozymes is the lactate dehydrogenase (LDH) system. LDH is a tetrameric enzyme composed of all possible arrangements of two different protein subunits; the subunits are known as H (for heart) and M (for skeletal muscle). These subunits combine in various combinations leading to five distinct isozymes. The all H isozyme is characteristic of that from heart tissue, and the all M isozyme is typically found in skeletal muscle and liver. These isozymes all catalyze the same chemical reaction, but they exhibit differing degrees of efficiency. The detection of specific LDH isozymes in the blood is highly diagnostic of tissue damage such as occurs during cardiac infarct (see below).
Enzyme-Substrate Interactions
The favored model of enzyme-substrate interaction is known as the induced-fit model. This model proposes that the initial interaction between enzyme and substrate is relatively weak, but that these weak interactions rapidly induce conformational changes in the enzyme that strengthen binding and bring catalytic sites close to substrate bonds to be altered. After binding takes place, one or more mechanisms of catalysis generate transition-state complexes and reaction products. The possible mechanisms of catalysis are four in number:
1. Catalysis by Bond Strain: In this form of catalysis, the induced structural rearrangements that take place with the binding of substrate and enzyme ultimately produce strained substrate bonds, which more easily attain the transition state. The new conformation often forces substrate atoms and bulky catalytic groups, such as aspartate and glutamate, into conformations that strain existing substrate bonds.
2. Catalysis by Proximity and Orientation: Enzyme-substrate interactions orient reactive groups and bring them into proximity with one another. In addition to inducing strain, groups such as aspartate are frequently chemically reactive as well, and their proximity and orientation toward the substrate thus favors their participation in catalysis.
3. Catalysis Involving Proton Donors (Acids) and Acceptors (Bases): Other mechanisms also contribute significantly to the completion of catalytic events initiated by a strain mechanism, for example, the use of glutamate as a general acid catalyst (proton donor).
4. Covalent Catalysis: In catalysis that takes place by covalent mechanisms, the substrate is oriented to active sites on the enzymes in such a way that a covalent intermediate forms between the enzyme or coenzyme and the substrate. One of the best-known examples of this mechanism is that involving proteolysis by serine proteases, which include both digestive enzymes (trypsin, chymotrypsin, and elastase) and several enzymes of the blood clotting cascade. These proteases contain an active site serine whose R group hydroxyl forms a covalent bond with a carbonyl carbon of a peptide bond, thereby causing hydrolysis of the peptide bond.
Chemical Reactions and Rates
According to the conventions of biochemistry, the rate of a chemical reaction is described by the number of molecules of reactant(s) that are converted into product(s) in a specified time period. Reaction rate is always dependent on the concentration of the chemicals involved in the process and on rate constants that are characteristic of the reaction. For example, the reaction in which A is converted to B is written as follows:
A → B
The rate of this reaction is expressed algebraically as either a decrease in the concentration of reactant A:
–[A] = k[B]
or an increase in the concentration of product B:
[B] = k[A]
In the second equation (of the 3 above) the negative sign signifies a decrease in concentration of A as the reaction progresses, brackets define concentration in molarity and the k is known as a rate constant. Rate constants are simply proportionality constants that provide a quantitative connection between chemical concentrations and reaction rates. Each chemical reaction has characteristic values for its rate constants; these in turn directly relate to the equilibrium constant for that reaction. Thus, reaction can be rewritten as an equilibrium expression in order to show the relationship between reaction rates, rate constants and the equilibrium constant for this simple case. The rate constant for the forward reaction is defined as k+1 and the reverse as k–1.
At equilibrium the rate (v) of the forward reaction (A → B) is, by definition, equal to that of the reverse or back reaction (B → A), a relationship which is algebraically symbolized as:
vforward = vreverse
where, for the forward reaction:
vforward = k+1[A]
and for the reverse reaction:
vreverse = k–1[B]
In the above equations, k+1 and k–1 represent rate constants for the forward and reverse reactions, respectively. The negative subscript refers only to a reverse reaction, not to an actual negative value for the constant. To put the relationships of the two equations into words, we state that the rate of the forward reaction [vforward] is equal to the product of the forward rate constant k+1 and the molar concentration of A. The rate of the reverse reaction is equal to the product of the reverse rate constant k–1 and the molar concentration of B.
At equilibrium, the rate of the forward reaction is equal to the rate of the reverse reaction leading to the equilibrium constant of the reaction and is expressed by:
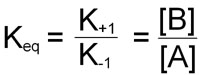
This equation demonstrates that the equilibrium constant for a chemical reaction is not only equal to the equilibrium ratio of product and reactant concentrations, but is also equal to the ratio of the characteristic rate constants of the reaction.
Examples of Coupled Reactions in Biology
Let’s look at the hypothetical reaction: A → B. If this is a thermodynamically unfavorable reaction the ΔGo’ value will be positive. Let’s assume it is +4.0 kcal/mol. In order to drive this reaction in the direction written it can be coupled to the hydrolysis of ATP. The free energy of ATP hydrolysis to ADP is shown:
ATP + H2O → ADP + Pi: ΔGo’ = –7.3 kcal/mol
Coupling the two reactions together gives the equation:
A + ATP + H2O → B + ADP + Pi + H+
The ΔGo’ for this coupled reaction is the sum of the ΔGo’ values of the two separate reactions, i.e. (–7.3kcal/mol) + (+4.0kcal/mol) = –3.3kcal/mol. This indicates that coupling ATP hydrolysis provides the energy necessary to make the conversion of A to B thermodynamically favorable.
Another useful example is to examine one of the reactions of glycolysis. In this case we will look at the oxidation of phosphoenolpyruvate to pyruvate catalyzed by the enzyme pyruvate kinase (PK).
phosphoenolpyruvate → pyruvate: ΔGo’ = –14.7 kcal/mol
This reaction releases sufficient energy to drive the synthesis of ATP from ADP which would normally be thermodynamically unfavorable with a ΔGo’ of +7.3kcal/mol. Note that this value is the reciprocal of the hydrolysis of ATP. This points out another fact that the ΔGo’ for a reaction in one direction is equal but mathematically opposite for the reciprocal direction. Coupling the two reactions together yields the following overall reaction:
phosphoenolpyruvate + ADP + H+ → pyruvate + ATP: ΔGo’ = –7.4 kcal/mol
The overall ΔGo’ value is, as indicated, simply the arithmetic sum of the ΔGo’ values for the two individual reactions.
Chemical Reaction Order
Reaction order refers to the number of molecules involved in forming a reaction complex that is competent to proceed to product(s). Empirically, order is easily determined by summing the exponents of each concentration term in the rate equation for a reaction. A reaction characterized by the conversion of one molecule of A to one molecule of B with no influence from any other reactant or solvent is a first-order reaction. The exponent on the substrate concentration in the rate equation for this type of reaction is 1. A reaction with two substrates forming two products would a second-order reaction. However, the reactants in second– and higher– order reactions need not be different chemical species. An example of a second order reaction is the formation of ATP through the condensation of ADP with orthophosphate:
ADP + H2PO4– ↔ ATP + H2O
For this reaction the forward reaction rate would be written as:
vforward = k1[ADP][H2PO4–]
The more biologically relevant concepts pertaining to reaction order consider the reaction order that relates to the onset of a reaction (defined as the initial velocity state of the reaction) and the point when the reaction rate no longer increases with addition of more substrate, the Vmax state of the reaction. These concepts are explained in detail below in the discussion of Michaelis-Menten kinetics. Briefly, when a biological reaction is at the initial stage it is said to be first order because any small addition of substrate rapidly accelerates the rate, whereas, at Vmax the reaction is zero order since no increase in rate is observable with addition of more substrate.
Enzymes as Biological Catalysts
In cells and organisms most reactions are catalyzed by enzymes, which are regenerated during the course of a reaction. These biological catalysts are physiologically important because they speed up the rates of reactions that would otherwise be too slow to support life. Enzymes increase reaction rates, sometimes by as much as one million-fold, but more typically by about one thousand fold. Catalysts speed up the forward and reverse reactions proportionately so that, although the magnitude of the rate constants of the forward and reverse reactions is are increased, the ratio of the rate constants remains the same in the presence or absence of enzyme. Since the equilibrium constant is equal to a ratio of rate constants, it is apparent that enzymes and other catalysts have no effect on the equilibrium constant of the reactions they catalyze.
Enzymes increase reaction rates by decreasing the amount of energy required to form a complex of reactants that is competent to produce reaction products. This complex is known as the activated state or transition state complex for the reaction. Enzymes and other catalysts accelerate reactions by lowering the energy of the transition state. The free energy required to form an activated complex is much lower in the catalyzed reaction. The amount of energy required to achieve the transition state is lowered; consequently, at any instant a greater proportion of the molecules in the population can achieve the transition state. The result is that the reaction rate is increased.
Michaelis-Menten Kinetics
In typical enzyme-catalyzed reactions, reactant and product concentrations are usually hundreds or thousands of times greater than the enzyme concentration. Consequently, each enzyme molecule catalyzes the conversion to product of many reactant molecules. In biochemical reactions, reactants are commonly known as substrates. The catalytic event that converts substrate to product involves the formation of a transition state, and it occurs most easily at a specific binding site on the enzyme. This site, called the catalytic site of the enzyme, has been evolutionarily structured to provide specific, high-affinity binding of substrate(s) and to provide an environment that favors the catalytic events. The complex that forms, when substrate(s) and enzyme combine, is called the enzyme substrate (ES) complex. Reaction products arise when the ES complex breaks down releasing free enzyme.
Between the binding of substrate to enzyme, and the reappearance of free enzyme and product, a series of complex events must take place. At a minimum an ES complex must be formed; this complex must pass to the transition state (ES*); and the transition state complex must advance to an enzyme product complex (EP). The latter is finally competent to dissociate to product and free enzyme. The series of events can be shown thus:
E + S ↔ ES ↔ ES* ↔ EP ↔ E + P
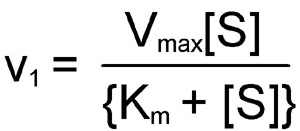
The kinetics of simple reactions like that above were first characterized by the German biochemists Leonor Michaelis and Maud Menten. The concepts underlying their analysis of enzyme kinetics continue to provide the cornerstone for understanding metabolism today, and for the development and clinical use of drugs aimed at selectively altering rate constants and interfering with the progress of disease states. The Michaelis-Menten equation is a quantitative description of the relationship among the rate of an enzyme-catalyzed reaction [v1], the concentration of substrate [S] and two constants, Vmax and Km (which are set by the particular equation). The symbols used in the Michaelis-Menten equation refer to the reaction rate [v1], maximum reaction rate (Vmax), substrate concentration [S] and the Michaelis-Menten constant (Km).
The Michaelis-Menten equation can be used to demonstrate that at the substrate concentration that produces exactly half of the maximum reaction rate, i.e. ½ Vmax, the substrate concentration is numerically equal to Km. This fact provides a simple yet powerful bioanalytical tool that has been used to characterize both normal and altered enzymes, such as those that produce the symptoms of genetic diseases. Rearranging the Michaelis-Menten equation leads to:
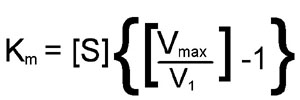
From this equation it should be apparent that when the substrate concentration is half that required to support the maximum rate of reaction, the observed rate (v1) will be equal to Vmax divided by 2; in other words, v1 = [Vmax/2]. At this substrate concentration Vmax/v1 will be exactly equal to 2, with the result that:
[S](1) = Km
The latter is an algebraic statement of the fact that, for enzymes of the Michaelis-Menten type, when the observed reaction rate is half of the maximum possible reaction rate, the substrate concentration is numerically equal to the Michaelis-Menten constant. In this derivation, the units of Km are those used to specify the concentration of S, usually Molarity.
The Michaelis-Menten equation has the same form as the equation for a rectangular hyperbola; graphical analysis of reaction rate (v) versus substrate concentration [S] produces a hyperbolic rate plot.
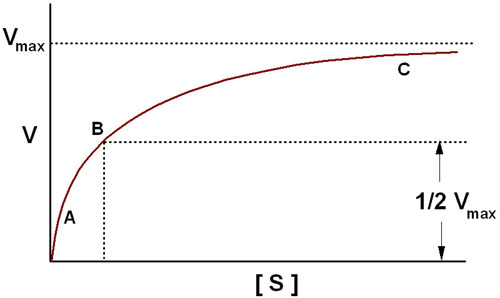
The key features of the plot are marked by points A, B and C. At high substrate concentrations, the rate represented by point C, the rate of the reaction is essentially equal to Vmax, and the difference in rate at nearby concentrations of substrate is almost negligible. At this point the reaction rate is dependent solely on the amount of enzyme and is therefore, occurring with zero order kinetics. If the Michaelis-Menten plot is extrapolated to infinitely high substrate concentrations, the extrapolated rate is equal to Vmax. When the reaction rate becomes independent of substrate concentration, or nearly so, the rate is said to be zero order. Note that the reaction is zero order only with respect to this substrate. If the reaction has two substrates, it may or may not be zero order with respect to the second substrate. The very small differences in reaction velocity at substrate concentrations around point C (near Vmax) reflect the fact that at these concentrations almost all of the enzyme molecules are bound to substrate and the rate is virtually independent of substrate, hence zero order. At lower substrate concentrations, such as at points A and B, the lower reaction velocities indicate that at any moment only a portion of the enzyme molecules are bound to the substrate. At the substrate concentration denoted by point B, exactly half the enzyme molecules are in an ES complex at any instant and the rate is exactly one half of Vmax which is equivalent to the Km. At substrate concentrations near point A the rate appears to be directly proportional to substrate concentration, and the reaction rate is said to be first order.
Inhibition of Enzyme Catalyzed Reactions
To avoid dealing with curvilinear plots of enzyme catalyzed reactions, biochemists Hans Lineweaver and Dean Burk introduced an analysis of enzyme kinetics based on the following double reciprocal rearrangement of the Michaelis-Menten equation:
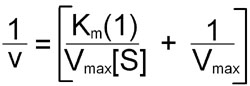
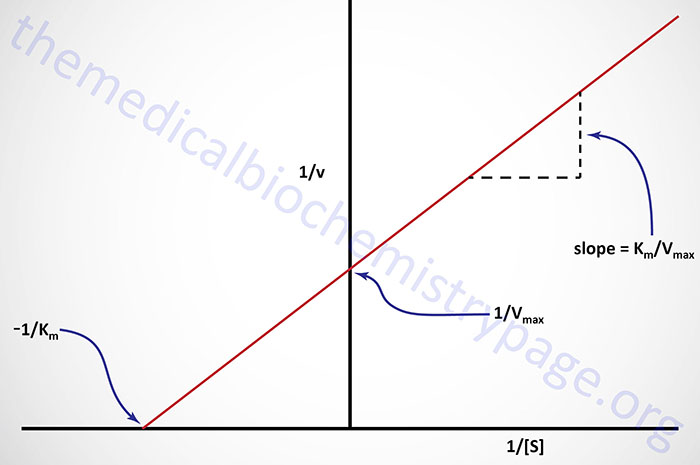
Plots of 1/v versus 1/[S] yield straight lines having a slope of Km/Vmax and an intercept on the ordinate at 1/Vmax.
An alternative linear transformation of the Michaelis-Menten equation is the Eadie-Hofstee transformation:
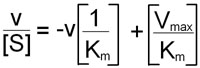
and when v/[S] is plotted on the y-axis versus v on the x-axis, the result is a linear plot with a slope of –1/Km and the value Vmax/Km as the intercept on the y-axis and Vmax as the intercept on the x-axis.
Both the Lineweaver-Burk and Eadie-Hofstee transformation of the Michaelis-Menten equation are useful in the analysis of enzyme inhibition. Since most clinical drug therapy is based on inhibiting the activity of enzymes, analysis of enzyme reactions using the tools described above has been fundamental to the modern design of pharmaceuticals. Well- known examples of such therapy include the use of methotrexate in cancer chemotherapy to semi-selectively inhibit DNA synthesis of malignant cells, the use of aspirin to inhibit the synthesis of prostaglandins which are at least partly responsible for the aches and pains of arthritis, and the use of sulfa drugs to inhibit the folic acid synthesis that is essential for the metabolism and growth of disease-causing bacteria. In addition, many poisons, such as cyanide, carbon monoxide and polychlorinated biphenols (PCBs) produce their life-threatening effects by means of enzyme inhibition.
Enzyme inhibitors fall into two broad classes: those causing irreversible inactivation of enzymes and those whose inhibitory effects can be reversed. Inhibitors of the first class usually cause an inactivating, covalent modification of enzyme structure. Cyanide (CN–) is a classic example of an irreversible enzyme inhibitor: by covalently binding the ferric (Fe3+) iron required for the function of mitochondrial cytochrome oxidase, it inhibits the reactions associated with complex IV of electron transport. The kinetic effect of irreversible inhibitors is to decrease the concentration of active enzyme, thus decreasing the maximum possible concentration of ES complex. Since the limiting enzyme reaction rate is often k2[ES], it is clear that under these circumstances the reduction of enzyme concentration will lead to decreased reaction rates. Note that when enzymes in cells are only partially inhibited by irreversible inhibitors, the remaining unmodified enzyme molecules are not distinguishable from those in untreated cells; in particular, they have the same turnover number and the same Km. Turnover number, related to Vmax, is defined as the maximum number of moles of substrate that can be converted to product per mole of catalytic site per second. Irreversible inhibitors are usually considered to be poisons and are generally unsuitable for therapeutic purposes.
Reversible inhibitors can be divided into two main categories; competitive inhibitors and noncompetitive inhibitors, with a third category, uncompetitive inhibitors, rarely encountered.
| Inhibitor Type | Binding Site on Enzyme | Kinetic effect |
| Competitive Inhibitor | Specifically at the catalytic site, where it competes with substrate for binding in a dynamic equilibrium-like process. Inhibition is reversible by substrate. | Vmax is unchanged; Km, as defined by [S] required for ½ maximal activity, is increased. |
| Noncompetitive Inhibitor | Binds E or ES complex other than at the catalytic site. Substrate binding unaltered, but ESI complex cannot form products. Inhibition cannot be reversed by substrate. | Km appears unaltered; Vmax is decreased proportionately to inhibitor concentration. |
| Uncompetitive Inhibitor | Binds only to ES complexes at locations other than the catalytic site. Substrate binding modifies enzyme structure, making inhibitor- binding site available. Inhibition cannot be reversed by substrate. | Apparent Vmax decreased; Km, as defined by [S] required for ½ maximal activity, is decreased. |
The hallmark of all the reversible inhibitors is that when the inhibitor concentration drops, enzyme activity is regenerated. Usually these inhibitors bind to enzymes by non-covalent forces and the inhibitor maintains a reversible equilibrium with the enzyme. The equilibrium constant for the dissociation of enzyme inhibitor complexes is known as Ki:
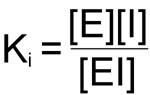
The importance of Ki is that in all enzyme reactions where substrate, inhibitor and enzyme interact, the normal Km and or Vmax for substrate enzyme interaction appear to be altered. These changes are a consequence of the influence of Ki on the overall rate equation for the reaction. The effects of Ki are best observed in Lineweaver-Burk plots.
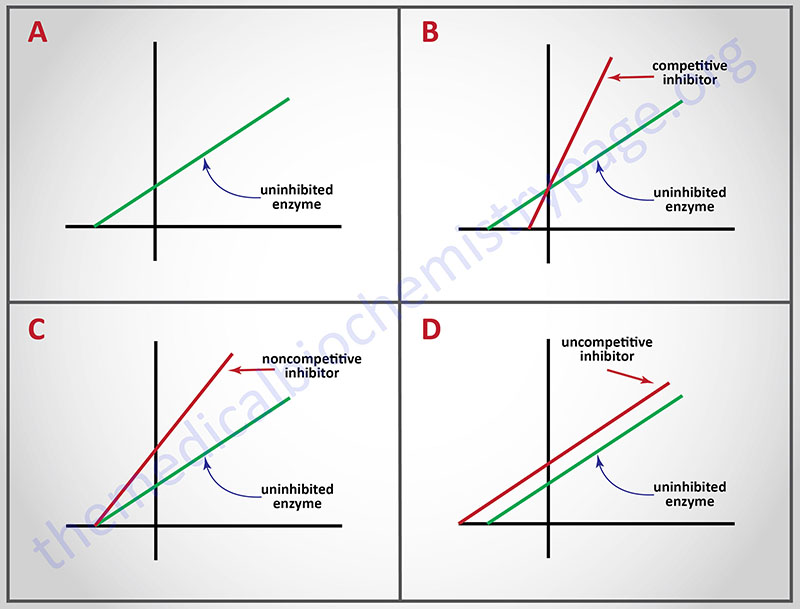
Probably the best known reversible inhibitors are competitive inhibitors, which always bind at the catalytic or active site of the enzyme. Most drugs that alter enzyme activity are of this type. Competitive inhibitors are especially attractive as clinical modulators of enzyme activity because they offer two routes for the reversal of enzyme inhibition, while other reversible inhibitors offer only one. First, as with all kinds of reversible inhibitors, a decreasing concentration of the inhibitor reverses the equilibrium regenerating active free enzyme. Second, since substrate and competitive inhibitors both bind at the same site they compete with one another for binding. Raising the concentration of substrate (S), while holding the concentration of inhibitor constant, provides the second route for reversal of competitive inhibition. The greater the proportion of substrate, the greater the proportion of enzyme present in competent ES complexes. As noted earlier, high concentrations of substrate can displace virtually all competitive inhibitor bound to active sites. Thus, it is apparent that Vmax should be unchanged by competitive inhibitors. This characteristic of competitive inhibitors is reflected in the identical vertical-axis (y-axis) intercepts of Lineweaver-Burk plots, with and without inhibitor. Since attaining Vmax requires appreciably higher substrate concentrations in the presence of competitive inhibitor, Km (the substrate concentration at half maximal velocity) is also higher, as demonstrated by the differing negative intercepts on the horizontal axis in panel B.
Analogously, panel C illustrates that noncompetitive inhibitors appear to have no effect on the intercept at the x-axis implying that noncompetitive inhibitors have no effect on the Km of the enzymes they inhibit. Since noncompetitive inhibitors do not interfere in the equilibration of enzyme, substrate and ES complexes, the Km‘s of Michaelis-Menten type enzymes are not expected to be affected by noncompetitive inhibitors, as demonstrated by x-axis intercepts in panel C. However, because complexes that contain inhibitor (ESI) are incapable of progressing to reaction products, the effect of a noncompetitive inhibitor is to reduce the concentration of ES complexes that can advance to product. Since Vmax = k2[Etotal], and the concentration of competent Etotal is diminished by the amount of ESI formed, noncompetitive inhibitors are expected to decrease Vmax, as illustrated by the y-axis intercepts in panel C.
A corresponding analysis of uncompetitive inhibition leads to the expectation that these inhibitors should change (decrease) the apparent values of Km as well as Vmax. Changing both constants leads to double reciprocal plots, in which intercepts on the x and y axes are proportionately changed; this leads to the production of parallel lines in inhibited and uninhibited reactions.
Problem Solving Enzyme Inhibition Questions
One of the things that causes problems for many students is trying to solve exam problems related to enzyme inhibition. Now certainly in many cases, students will be required to carry out calculations that are aimed at determining the changed values of Km and/or Vmax in these types of problems. However, many times it is just a matter of understanding what effects various inhibitors exert and how to quickly recognize the type of inhibitor used in the context of an exam problem. In most cases questions will pertain to either competitive or noncompetitive inhibitors since these are most commonly encountered in a clinical context, e.g. pharmacology. This is quite easily accomplished for two types of problems.
In one case the problem may contain a Table of Vmax and Km values in the absence and presence of an inhibitor and the question asks for identification of which kind of inhibitor is used. In this case DO NOT concern yourself with the direction (up or down) of the changes, look only for which one of the two kinetic parameters is changing. Remember that for competitive inhibitors ONLY Km changes. Yes the value of Km increases but for these types of problems that is not the important concept to remember, it is that Km and NOT Vmax changes. Conversely, for noncompetitive inhibitors Km does not change ONLY Vmax changes. Again in this case we learned that for noncompetitive inhibitors Vmax decreases but for these types of problems it is only important to remember that Vmax changes while Km does not for noncompetitive inhibitors.
The second common type of problem may also include a Table of kinetic values (mainly to throw the student off balance) but will also contain a Lineweaver-Burk plot. In this latter case look immediately at the plot and determine if the lines cross or not. In these types of problems if the lines Cross the inhibitor is a Competitive inhibitor, whereas, if the lines No cross then the inhibitor is a Noncompetitive inhibitor.
Regulation of Enzyme Activity
While it is clear that enzymes are responsible for the catalysis of almost all biochemical reactions, it is important to also recognize that rarely, if ever, do enzymatic reactions proceed in isolation. The most common scenario is that enzymes catalyze individual steps of multi-step metabolic pathways, as is the case with glycolysis, gluconeogenesis or the synthesis of fatty acids. As a consequence of these lock–step sequences of reactions, any given enzyme is dependent on the activity of preceding reaction steps for its substrate.
In humans, substrate concentration is dependent on food supply and is not usually a physiologically important mechanism for the routine regulation of enzyme activity. Enzyme concentration, by contrast, is continually modulated in response to physiological needs. Three principal mechanisms are known to regulate the concentration of active enzyme in tissues:
1. Regulation of gene expression controls the quantity and rate of enzyme synthesis.
2. Proteolytic enzyme activity determines the rate of enzyme degradation.
3. Covalent modification of preexisting pools of inactive proenzymes produces active enzymes.
Enzyme synthesis and proteolytic degradation are comparatively slow mechanisms for regulating enzyme concentration, with response times of hours, days or even weeks. Proenzyme activation is a more rapid method of increasing enzyme activity but, as a regulatory mechanism, it has the disadvantage of not being a reversible process. Proenzymes are generally synthesized in abundance, stored in secretory granules and covalently activated upon release from their storage sites. Examples of important proenzymes include pepsinogen, trypsinogen and chymotrypsinogen, which give rise to the proteolytic digestive enzymes. Likewise, many of the proteins involved in the cascade of chemical reactions responsible for blood clotting are synthesized as proenzymes. Other important proteins, such as peptide hormones and collagen, are also derived by covalent modification of precursors.
Another mechanism of regulating enzyme activity is to sequester enzymes in compartments where access to their substrates is limited. For example, the proteolysis of cell proteins and glycolipids by enzymes responsible for their degradation is controlled by sequestering these enzymes within the lysosomes.
In contrast to regulatory mechanisms that alter enzyme concentration, there is an important group of regulatory mechanisms that do not affect enzyme concentration, are reversible and rapid in action, and actually carry out most of the moment to moment physiological regulation of enzyme activity. These mechanisms include allosteric regulation, regulation by reversible covalent modification and regulation by control proteins such as calmodulin. Reversible covalent modification is a major mechanism for the rapid and transient regulation of enzyme activity. The best examples, again, come from studies on the regulation of glycogen metabolism where phosphorylation of glycogen phosphorylase and glycogen synthase results in the stimulation of glycogen degradation while glycogen synthesis is coordinately inhibited. Numerous other enzymes of intermediary metabolism are affected by phosphorylation, either positively or negatively. These covalent phosphorylations can be reversed by a separate sub-class of enzymes known as phosphatases. Numerous lines of evidence clearly demonstrate that the aberrant phosphorylation of growth factor and hormone receptors, as well as of proteins that regulate cell division, often lead to unregulated cell growth or cancer. The usual sites for phosphate addition to proteins are the serine, threonine and tyrosine R-group hydroxyl residues.
Allosteric Enzymes
In addition to simple enzymes that interact only with substrates and inhibitors, there is a class of enzymes that bind small, physiologically important molecules and modulate activity in ways other than those described above. These are known as allosteric enzymes; the small regulatory molecules to which they bind are known as effectors. Allosteric effectors bring about catalytic modification by binding to the enzyme at distinct allosteric sites, well removed from the catalytic site, and causing conformational changes that are transmitted through the bulk of the protein to the catalytically active site(s).
The hallmark of effectors is that when they bind to enzymes, they alter the catalytic properties of an enzyme’s active site. Those that increase catalytic activity are known as positive effectors. Effectors that reduce or inhibit catalytic activity are negative effectors.
Most allosteric enzymes are oligomeric (consisting of multiple subunits); generally they are located at or near branch points in metabolic pathways, where they are influential in directing substrates along one or another of the available metabolic paths. The effectors that modulate the activity of these allosteric enzymes are of two types. Those activating and inhibiting effectors that bind at allosteric sites are called heterotropic effectors. Thus, there exist both positive and negative heterotropic effectors. These effectors can assume a vast diversity of chemical forms, ranging from simple inorganic molecules to complex nucleotides such as cyclic adenosine monophosphate (cAMP). Their single defining feature is that they are not identical to the substrate.
In many cases the substrate itself induces distant allosteric effects when it binds to the catalytic site. Substrates acting as effectors are said to be homotropic effectors. When the substrate is the effector, it can act as such, either by binding to the substrate-binding site, or to an allosteric effector site. When the substrate binds to the catalytic site it transmits an activity-modulating effect to other subunits of the molecule. Often used as the model of a homotropic effector is hemoglobin, although it is not a branch-point enzyme and thus does not fit the definition on all counts.
There are two ways that enzymatic activity can be altered by effectors: the Vmax can be increased or decreased, or the Km can be raised or lowered. Enzymes whose Km is altered by effectors are said to be K-type enzymes and the effector a K-type effector. If Vmax is altered, the enzyme and effector are said to be V-type. Many allosteric enzymes respond to multiple effectors with V-type and K-type behavior. Here again, hemoglobin is often used as a model to study allosteric interactions, although it is not strictly an enzyme.
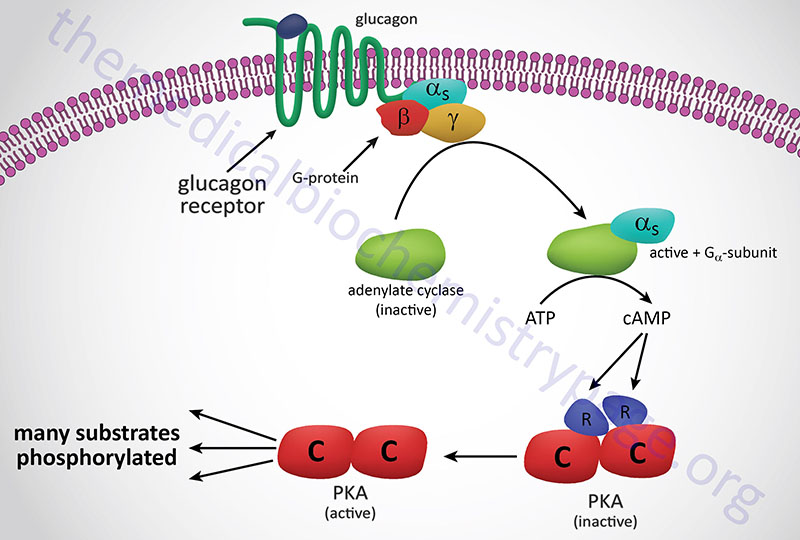
In the preceding discussion we assumed that allosteric sites and catalytic sites were homogeneously present on every subunit of an allosteric enzyme. While this is often the case, there is another class of allosteric enzymes that are comprised of separate catalytic and regulatory subunits. The archetype of this class of enzyme are the cAMP-dependent protein kinases (PKA), whose mechanism of activation is illustrated in the Figure below. These enzymes are heterotetrameric, containing two catalytic subunits and two regulatory subunits, and enzymatically inactive. When intracellular cAMP levels rise, one molecule of cAMP binds to each regulatory subunit, causing the tetramer to dissociate into one regulatory dimer and two catalytic monomers. In the dissociated form, the catalytic subunits are fully active; they catalyze the phosphorylation of a number of other enzymes, such as those involved in regulating glycogen metabolism. The regulatory subunits have no catalytic activity.
Enzymes in the Diagnosis of Pathology
The measurement of the serum levels of numerous enzymes has been shown to be of diagnostic significance. This is because the presence of these enzymes in the serum indicates that tissue or cellular damage has occurred resulting in the release of intracellular components into the blood. For example, when a physician indicates that he/she is going to assay for liver enzymes, the purpose is to ascertain the potential for liver cell damage.
Commonly assayed enzymes in the blood are the aminotransferases (equally correct is the term transaminase): alanine transaminase, ALT (sometimes still referred to as serum glutamate-pyruvate transaminase, SGPT) and aspartate transaminase, AST (also referred to as serum glutamate-oxaloacetate transaminase, SGOT). Humans express a cytosolic AST and a mitochondrial AST, both of which function as homodimeric enzymes, and are encoded by distinct genes (cytosolic: GOT1; mitochondrial: GOT2).
The enzymes cardiac troponin I (cTnI), lactate dehydrogenase (LDH), and creatine kinase (CK, also called creatine phosphokinase, CPK) are commonly measured in the diagnosis of cardiac infarct.
Gamma-glutamyltranferase (GGT, γ-glutamyltransferase; also called gamma-glutamyl transpeptidase) is involved in glutathione (GSH) metabolism and also in amino acid transport across membranes. Assessment of GGT levels in the blood is diagnostic for diseases of the liver and the biliary system as well as disease of the pancreas.
Carbonic anhydrases are enzymes that catalyze the formation of carbonic acid (H2CO3) from CO2 and H2O, These enzymes are useful both as pharmacologic targets and as diagnostic tools in certain disease states. Other enzymes are assayed under a variety of different clinical situations but they will not be covered here.
Liver Function Enzymes
The typical liver enzymes measured are aspartate transaminase (AST) and alanine transaminase (ALT). The diagnostically useful AST isoform is a cytoplasmic enzyme encoded by the GOT1 (glutamate oxaloacetate transaminase 1) gene while the ALT enzyme is encoded by the GPT (glutamate pyruvate transaminase) gene. A second GOT gene (GOT2) encodes a mitochondrial version of AST which participates in the malate-aspartate shuttle. ALT is particularly diagnostic of liver involvement as this enzyme is found predominantly in hepatocytes. When assaying for both ALT and AST the ratio of the level of these two enzymes can also be diagnostic. Normally in liver disease or damage that is not of viral origin the ratio of ALT/AST is less than 1. However, with viral hepatitis the ALT/AST ratio will be greater than 1.
Measurement of AST is useful not only for liver involvement but also for heart disease or damage. The level of AST elevation in the serum is directly proportional to the number of cells involved as well as on the time following injury that the AST assay was performed. Following injury, levels of AST rise within 8 hours and peak 24–36 hours later. Within 3–7 days the level of AST should return to pre-injury levels, provided a continuous insult is not present or further injury occurs. Although measurement of AST is not, in and of itself, diagnostic for myocardial infarction, taken together with LDH and CK measurements (see below) the level of AST is useful for timing of the infarct.
Cardiac Troponins
Troponins are complexes composed of three regulatory proteins, troponin C (TnC), troponin I (TnI), and troponin T (TnT) attached to tropomyosin and are found in the grooves between thin actin filaments in striated muscle tissue. The troponins are found in skeletal and cardiac muscle but not smooth muscle. The TnI subfamily is composed of three isoforms identified as TnI-skeletal-fast-twitch, TnI-skeletal-slow-twitch, and TnI-cardiac. The cardiac-specific TnI isoform is encoded by the TNNI3 (troponin I type 3, cardiac) gene. Cardiac troponins found in the serum, specifically troponin I and T, are excellent markers for myocardial infarction as well as for any other type of heart muscle damage. The measurement of plasma troponin I levels are highly diagnostic of necrosis of cardiac muscle. Serum levels of troponin I rise within 4-8 hrs after the onset of chest pains caused by myocardial infarction. The levels peak within 12-16 hrs after the onset of infarction and return to baseline within 5-9 days. Although measurement of serum LDH fractions was once considered the ideal marker for onset and severity of a heart attack, the high specificity of troponin I to heart muscle necrosis makes this protein the preferred marker to measure in patients suspected of suffering a myocardial infarct.
Lactate Dehydrogenases
The measurement of lactate dehydrogenase (LDH) is especially diagnostic for myocardial infarction because this enzyme exists in five closely related, but slightly different forms (isozymes). These five isoforms are generated by combinations of two different subunits encoded by two different genes. The subunits are identified as the M form for muscle-specific (encoded by the LDHA gene) and the H form for heart-specific (encoded by the LDHB gene). Humans also express two additional LDH genes: LDHC (expression restricted to testis) and LDHD (mitochondrial enzyme specific for D-lactate). The five types of LDH used in diagnosis and their normal distribution and levels in non-disease/injury are listed below.
- LDH 1 (H4) – Found in heart and red-blood cells and is 17% – 27% of the normal serum total.
- LDH 2 (H3M1) – Found in heart and red-blood cells and is 27% – 37% of the normal serum total.
- LDH 3 (H2M2) – Found in a variety of organs and is 18% – 25% of the normal serum total.
- LDH 4 (HM3) – Found primarily in pancreas and kidneys and is 5% – 16% of the normal serum total.
- LDH 5 (M4) – Found primarily in liver and striated muscle and is 3% – 15% of the normal serum total.
Following a myocardial infarct the serum levels of LDH rise within 24-48 hours reaching a peak by 2–3 days and return to normal in 5-10 days. Especially diagnostic is a comparison of the LDH-1/LDH-2 ratio. Normally, this ratio is less than 1. A reversal of this ration is referred to as a “flipped LDH”. Following an acute myocardial infarct the flipped LDH ratio will appear in 12–24 hours and is definitely present by 48 hours in over 80% of patients. Also important is the fact that persons suffering chest pain due to angina only will not likely have altered LDH levels.
Creatine Kinases
Creatine kinase (CK, or creatine phosphokinase, CPK) is found primarily in heart and skeletal muscle as well as the brain. Therefore, measurement of serum CPK levels is a good diagnostic for injury to these tissues. The levels of CPK will rise within 6 hours of injury and peak by around 18 hours. If the injury is not persistent the level of CK returns to normal within 2–3 days. Like LDH, there are tissue-specific isoforms of CPK derived from the expression of two distinct creatine kinase genes. The muscle CPK isoform is expressed from the creatine kinase, muscle (CKM) gene while the brain isoform is expressed from the CKB gene. Dependent upon the tissue of expression, three major CPK isoforms are found in human tissues.
- CPK3 (CPK-MM) is a homodimer of two CKM encoded proteins and is the predominant isoform in muscle and is 100% of the normal serum total.
- CPK2 (CPK-MB) is a heterodimer of the CKM and CKB encoded proteins and this form accounts for about 35% of the CPK activity in cardiac muscle, but less than 5% in skeletal muscle and is 0% of the normal serum total.
- CPK1 (CPK-BB) is a homodimer of two CKB encoded proteins and is the characteristic isoform in brain and is in significant amounts in smooth muscle and several other tissues and is 0% of the normal serum total.
Since most of the released CPK after a myocardial infarction is CPK-MB, an increased ratio of CPK-MB to total CPK may help in diagnosis of an acute infarction, but an increase of total CPK in itself may not. CPK-MB levels rise 3–6 hours after a myocardial infarct and peak 12–24 hours later if no further damage occurs and returns to normal 12–48 hours after the infarct.
Gamma-Glutamyltransferases
Gamma glutamyltransferases (GGT; also known as gamma glutamyl transpeptidases) are a family of enzymes that catalyze the transfer of the glutamyl moiety of glutathione to a variety of amino acids and dipeptide acceptors. There are five primary GGT encoding genes in the human genome. All five of these genes (GGT1, GGT2, GGT5, GGT6, and GGT7) encode a precursor protein that is post-translationally cleaved into a heavy and a light chain. The heavy chain anchors the enzyme to the membranes while the light chain possesses the catalytic activity. In addition to these five genes there are three human genes that encode GGT light chain proteins only and, therefore, the encoded proteins are not associated with membranes. These three genes are identified as GGTLC1, GGTLC2, and GGTLC3. The highest concentration of GGT enzyme is derived from the GGT1 gene. Normal plasma levels of GGT are 15–85 IU/L for males and 5–55 IU/L for women. Elevated serum GGT levels are found in diseases of the liver, biliary system, and pancreas. Slight elevations in serum GGT levels are also seen in cardiovascular disease, in particular, GGT accumulates in atherosclerotic plaques. GGT-containing protein aggregates circulate in the blood in certain pathologies such as the metabolic syndrome, alcohol addiction, and chronic liver disease.
Carbonic Anhydrases
The carbonic anhydrases (CA) are members of a large family of genes encoding zinc metalloenzymes that possess significant physiological importance. There are five distinct classes of CA found in prokaryotes and eukaryotes identified as α, β, γ, δ, and ε. The α-class of CA are found in mammals.
Humans express 15 isoforms of CA with 12 of these isoforms exhibiting functional enzymatic activity. These 12 human catalytic CA isoforms are identified as hCA I–IV, VA, VB, VI, VII, IX, XII, XIII, and XIV. The gene nomenclature for the carbonic anhydrases is CA1-CA4, CA5A, CA5B, CA6, CA7, CA9, CA12, CA13, and CA14. The various CAs differ in catalytic activity, tissue distribution, as well as subcellular localization which includes cytosolic, secreted, membrane-bound, and mitochondrial.
The cytoplasmic CA isoforms are CA I, CA II, CA III, CA VII, and CA XIII. The CA II isoform is predominantly expressed in the erythrocyte.
The CA isoform that is anchored to the membrane via a glycosylphosphatidylinositol (GPI) linkage is CA IV.
The mitochondrial CA isoforms are CA VA and CA VB.
The CA VI isoform is a secreted enzyme and is only expressed in salivary glands.
The transmembrane CA isoforms are CA IX, CA XII, and CA XIV.
Humans express three additional genes designated as carbonic anhydrases due to sequence similarity to functional carbonic anhydrases, however, the encoded proteins do not possess carbonic anhydrase activity. These three genes are designated CA8, CA10, and CA11 and all three are predominantly expressed within the CNS. Although the encoded proteins of these three CA related genes lack CA activity, the importance of the proteins can be demonstrated by the fact that the neurological defect in the lurcher mutant mouse is the result of a loss of CA8 gene expression.
The CAs catalyze the reversible interconversion of CO2 and HCO3– and as such these enzymes are involved in respiration, calcification, acid-base balance, bone resorption, and the formation of aqueous humor, cerebrospinal fluid, saliva, pancreatic exocrine secretions of digestion, and gastric acid. The two CAs expressed in erythrocytes are CA I and CA II, both of which are cytosolic enzymes. The presence of CA in erythrocytes is critical for the transfer of CO2 from the tissues to the lungs. CA I and CA II along with CA VB and CA IX are expressed within the GI tract where they play an important role in overall digestive processes. CA II is found in cerebrospinal fluid and measurement of increases are useful in the diagnosis of various brain diseases. Increased levels of serum CA III are associated with myocardial infarction.
A physiological significance of CAs is related to their role in renal control of acid-base balance and as pharmacologic targets in the control of hypertension, glaucoma, and epilepsy. Several isozymes of carbonic anhydrase are expressed in the human kidney including CA II, CA IV, CA VB, CA XII, CA XIII, and CA XIV. The carbonic anhydrase, CA IX (expression predominately in the gut), is one of only two tumor-associated carbonic anhydrases with CA XII being the other. Expression of CA IX is associated with renal cell carcinomas (RCC) but it is not expressed at all in normal renal tissues which makes it a useful diagnostic marker for this disease.
Carbonic anhydrase inhibitors have a broad spectrum of utility including the treatment of glaucoma, as anti-epileptics, and as diuretics in the treatment of certain forms of hypertension. The CA inhibitors that are diuretics function by inhibiting the CA isoforms present in the proximal convoluted tubule (PCT) of the kidney. The major CA expressed in the PCT is CA II. The principal drugs used as diuretics are acetazolamide and methazolamide. The inhibition of CA by these drugs results in bicarbonate retention in the urine, potassium retention in urine and decreased sodium reabsorption. One of the effects of acetazolamide in the kidney is alkalization of the urine. This effect makes acetazolamide useful in the treatment of cystinurias.