

Last Updated: June 21, 2026
Definition of Diabetes
Diabetes is any disorder characterized by excessive urine excretion. The most common form of diabetes is diabetes mellitus, a metabolic disorder in which there is an inability to maintain carbohydrate and lipid homeostasis due to disturbances in insulin function, resulting in hyperglycemia and excess urinary excretion of glucose as well as hyperlipidemia. Diabetes mellitus is characterized by chronic hyperglycemia and the potential for episodic ketoacidosis. Additional symptoms of diabetes mellitus include excessive thirst, (polydipsia) glucosuria, polyuria, lipemia and hunger (polyphagia).
There are two primary forms of diabetes mellitus, type 1 and type 2. Type 1 is defined by the loss of insulin production by the pancreas and type 2 is defined by loss of peripheral responses to insulin. If left untreated type 1 diabetes can lead to fatal ketoacidosis. Of the two major forms of diabetes mellitus, type 2 represents the prevalent form of the disease. Indeed, in the US type 2 diabetes could easily be considered at epidemic proportions.
Other forms of diabetes include diabetes insipidus, brittle diabetes, and bronze diabetes. Diabetes insipidus is characterized by the excess output (3–20 liters per day; normal is less than 3 liters per day) of dilute urine. There are four major classifications of diabetes insipidus, each of which is related to the primary site/cause of the excess urine output. These forms are referred to as central, nephrogenic, dipsogenic, and gestational.
Central diabetes insipidus relates to pathologies that affect the hypothalamus or the pituitary resulting in defects in vasopressin (antidiuretic hormone, ADH) synthesis or release.
Nephrogenic diabetes insipidus results from the loss of, or abnormal, responses of the kidneys to the actions of vasopressin.
Dipsogenic diabetes insipidus relates to disturbances in the hypothalamic control of thirst.
Gestational diabetes insipidus results from excess maternal production of prostaglandins or it is due to placental synthesis of an enzyme called vasopressinase (leucyl and cystinyl aminopeptidase; encoded by the LNPEP gene) that results in degradation of vasopressin.
Brittle diabetes is a sub-type of type 1 diabetes that is very difficult to control. It is characterized by unexplained oscillations between hyperglycemia, hypoglycemia and acidosis.
Bronze diabetes is the term used to describe the hyperglycemia that is frequent in patients with hemochromatosis. This disease is associated with elevated bilirubin deposition in the skin resulting in the yellowing characteristic of jaundice, hence the bronze term.
Criteria, which clinically establish an individual as suffering from type 2 diabetes mellitus, include:
- having a fasting plasma glucose level in excess of 126mg/dL (7mmol/L). Normal levels should be less than 100mg/dL (5.6mmol/L) or:
- having plasma glucose levels in excess of 200mg/dL (11mmol/L) at two times points during an oral glucose tolerance test, OGTT, one of which must be within 2 hrs of ingestion of glucose.
Different clinical labs may use different units for the measurement of serum glucose concentrations, either in mmol/L or mg/dL. One can easily interconvert these values using the following formulas:
mg/dL x 0.0555 = mmol/L (or simply divide mg/dL by 18)
mmol/L x 18.0182 = mg/dL (or simply multiply mmol/L by 18)
The earlier a person is diagnosed with diabetes (principally type 2) the better chance the person has of staving off the primary negative consequences which are renal failure, blindness and limb amputations due to circulatory problems. The American Diabetes Association recommends that physicians consider patients to be pre-diabetic if their fasting blood glucose level is above 100mg/dL but less than 125mg/dL and whose glucose levels are at least 140mg/dL but less than 200mg/dL following an oral glucose tolerance test (OGTT).
Types of Diabetes Mellitus
Diabetes mellitus is a heterogeneous clinical disorder with numerous causes. Two main classifications of diabetes mellitus exist, idiopathic and secondary.
Idiopathic diabetes is divided into two main types; insulin dependent and non-insulin-dependent. Insulin-dependent diabetes mellitus, IDDM (more commonly referred to as type 1 diabetes) is defined by the development of ketoacidosis in the absence of insulin therapy. See the Diabetic Ketoacidosis diagnosis and treatment page. Type 1 diabetes most often manifests in childhood (hence, also called juvenile onset diabetes) and is the result of an autoimmune destruction of the β-cells of the pancreas. Non-insulin-dependent diabetes mellitus, NIDDM (more commonly referred to as type 2 diabetes) is characterized by persistent hyperglycemia but rarely leads to ketoacidosis. Type 2 diabetes generally manifests after age 40 and therefore has the obsolete name of adult onset-type diabetes. However, due to the rising rates of adolescent obesity in industrialized countries there is an increasing incidence of type 2 diabetes in pre- and postpubescent children. Type 2 diabetes can also result from genetics defects that cause both insulin resistance and insulin deficiency. There are two main forms of type 2 diabetes:
- Late onset associated with obesity.
- Late onset not associated with obesity.
There is a strong correlation between obesity and the onset of type 2 diabetes with its associated insulin resistance. It should be pointed out that in the United States the proportion of the population under 40 that can be clinically defined as obese now exceeds 25%. Many children are obese and are developing type 2 diabetes at an alarming epidemic rate. The dramatic rise in obesity in the US has lead to an equally alarming increase in the percentage of the population who suffer from the metabolic syndrome.
The metabolic syndrome is a clustering of atherosclerotic cardiovascular disease risk factors, one of which involves insulin resistance characteristic in type 2 diabetes. It should be pointed out that obesity alone does not always lead to insulin resistance as some individuals who are obese do not experience insulin resistance and conversely, some individuals who manifest insulin resistance are not obese. These latter observations point to the added role of genetics in the acquisition of insulin resistance.
Maturity Onset Type Diabetes of the Young: MODY
Maturity onset type diabetes of the young (MODY) was previously considered to be a third form of type 2 diabetes. However, with the discovery of specific mutations leading to MODY, it is now classified under secondary or other specific types of diabetes. In contrast to classic type 2 diabetes which is a multifactorial (polygenic and environmental contributions) disease, MODY represent a family of monogenic causes of diabetes mellitus.
MODY is characterized by onset prior to age 25. All cases to date have shown impaired β-cell function. Patients may also exhibit insulin resistance and late β-cell failure. Evidence indicates that mutations in at least 14 different genes have been correlated with the development of various forms of MODY. Of the 14 characterized forms, MODY1, MODY2, MODY3, and MODY5 represent the most commonly identified.
- MODY1: Is a form of familial symptomatic diabetes that is less prevalent than MODY3. MODY1 results from mutations in the gene (HNF4A) encoding the transcription factor identified as hepatic nuclear factor-4α (HNF-4α). This protein is also known as transcription factor-14 (TCF14). HNF-4α is a member of the nuclear receptor family of transcription factors, specifically identified as NR2A1. Expression of HNF-4α is associated with the growth and normal functioning of the pancreas. Many genes are known to be regulated by HNF-4α including those encoding HNF-1α, PPARα, insulin, glucose-6-phosphatase, GLUT2, the liver pyruvate kinase isoform (L-PK which is also expressed in the pancreas), glyceraldehyde-3-phosphate dehydrogenase (GAPDH), aldolase B, and uncoupling protein 2, UCP2.
- MODY2: Autosomal dominant disorder resulting from mutations in the glucokinase (GCK) gene. Represents the first form of MODY to be molecularly characterized. Insulin secretion is coupled to the generation of ATP which primarily occurs from glucose oxidation. A lack of glucokinase prevents glucose from being phosphorylated resulting in lack of glycolysis.
- MODY3: Is the most common form of MODY that results in familial symptomatic diabetes. Results from mutations in the gene (HNF1A) encoding the transcription factor HNF-1α. This protein is also known as hepatocyte transcription factor-1 (TCF1). HNF-1α is involved in a regulatory loop with HNF-4α controlling many genes involved in liver function such as the gene (SLC2A2) encoding GLUT2 and the gene (PKLR) encoding liver pyruvate kinase (L-PK). Also involved in the expression of the gene (SLC5A2) encoding sodium-glucose linked transporter 2 (SGLT2), the primary glucose reabsorption transporter in the kidney. Usually presents during adolescence or young adulthood with initial post-prandial hyperglycemia followed by fasting hyperglycemia.
- MODY4: Results from mutations in the gene encoding homeodomain transcription factor insulin promoter factor-1 (IPF-1). This gene is more commonly called PDX1 which is derived from pancreas duodenum homeobox-1. PDX1 is required for the development of the pancreas.
- MODY5: Is also known as renal cyst and diabetes syndrome (RCAD). Results from mutations in the gene (HNF1B) encoding the transcription factor HNF-1β. This gene is also known as hepatocyte transcription factor-2 (TCF2). HNF-1β is a critical regulator of a transcriptional network that controls the specification, growth, and differentiation of the embryonic pancreas. In humans, mutations in the HNF1B gene are associated with pancreatic hypoplasia, defective kidney development and genital malformations.
- MODY6: Results from mutations in the gene (NEUROD1) encoding the bHLH transcription factor NeuroD1. NeuroD1 was first identified as a neural fate-inducing gene. The hamster β2 gene, shown to regulate insulin transcription is identical to NeuroD1 so the gene is often referred to as NeuroD/β2. MODY6 is a rare form of MODY representing less than 1% of adult-onset diabetes.
- MODY7: Results from mutations in the gene (KLF11) encoding the Krüpple-like factor 11 protein. The KFL11 protein is a zinc-finger transcription factor that is involved in activation of the insulin promoter. KLF11 is a TGF-β-inducible transcription factor.
- MODY8: Results from mutation in the gene encoding carboxyl ester lipase (CEL). Carboxyl ester lipase (formerly called cholesterol esterase) is involved in cholesterol uptake from the small intestines and the hydrolysis of tri-, di-, and monoglycerides, phospholipids, lysophospholipids, and ceramide. Frameshift deletions in the variable number tandem repeats (VNTR) of the CEL gene are associated with MODY8 which is characterized by pancreatic exocrine and β-cell dysfunction. MODY8 is a very rare form of MODY representing less than 1% of adult-onset diabetes.
- MODY9: Results from mutations in the gene encoding the paired box transcription factor family member, PAX4. The PAX4 encoded protein is involved in islet cell development.
- MODY10: Results from mutations in the gene (INS) encoding insulin. It should be obvious that the lack of an ability to produce functional insulin will be associated with chronic elevated plasma glucose, a hallmark of diabetes mellitus.
- MODY11: Results from mutations in the gene encoding non-receptor tyrosine kinase identified as B-lymphocyte specific tyrosine kinase, BLK. Within the pancreas BLK modulates of β-cell function through the up-regulation of PDX1 (MODY4) and NKX6-1 which are involved in the stimulation of insulin secretion in response to glucose.
- MODY12: Results from specific types of mutations in the gene (ABCC8) encoding the transporter protein, ATP-binding cassette transporter subfamily C member 8. Forms a hetero-octomeric transporter with the protein encoded by the KCNJ11 gene. Mutations in the ABCC8 gene are more commonly associated with neonatal diabetes mellitus. There is large clinical heterogeneity in MODY12 patients, even in relatives with the same mutation. This heterogeneity manifests with mild impaired glucose tolerance to severe insulin-dependent diabetes mellitus and age at diagnosis which can range from 2 to 53 years.
- MODY13: Results from mutations if the gene encoding the pancreatic β-cell potassium channel subunit KCNJ11 (Kir6.2). The KCNJ11 encoded protein forms a hetero-octomeric transporter with the protein encoded by the ABCC8 gene.
- MODY14: Results from mutations in the gene (APPL1) encoding the protein identified as adaptor protein, phosphotyrosine interacting with PH domain and leucine zipper 1. MODY14 is an autosomal dominant form of MODY
Causes of Secondary (or other specific types of) Diabetes Mellitus
1. Pancreatic disease: Pancreatectomy leads to the clearest example of secondary diabetes. Cystic fibrosis and pancreatitis can also lead to destruction of the pancreas.
2. Endocrine disease: Some tumors can produce counter-regulatory hormones that oppose the action of insulin or inhibit insulin secretion. These counter-regulatory hormones are glucagon, epinephrine, growth hormone and cortisol.
- Glucagonomas are pancreatic cancers that secrete glucagon.
- Pheochromocytomas secrete epinephrine.
- Cushing syndrome results from excess cortisol secretion.
- Acromegaly results in excess growth hormone production.
3. Drug-induced diabetes; treatment with glucocorticoids and diuretics can interfere with insulin function.
4. Anti-insulin receptor autoantibodies (Type B insulin resistance).
5. Mutations in the insulin receptor gene (INSR) which lead to the family of three syndromes listed below. Common clinical features in all three syndromes that result from mutations in the insulin receptor gene including severe insulin resistance, acanthosis nigricans and hyperandrogenism (the latter being observed only in females).
- Donohue syndrome (also referred to as Leprachaunism), represents the most severe form of this family of disorders, most children die before the age of 2
- Rabson-Mendenhall syndrome, symptoms appear in early childhood, most patients die in their teens or early twenties
- Type A insulin resistance syndrome is a rare disorder of severe insulin resistance, symptoms usually do not appear until puberty or later
6. Gestational diabetes; this syndrome sets in during pregnancy and usually resolves itself following childbirth.
7. Many other genetic syndromes have either diabetes or impaired glucose tolerance associated with them; lipoatrophic diabetes, Wolfram syndrome, Down syndrome, Klinefelter syndrome (XXY males), Turner syndrome, type 1 myotonic dystrophy, muscular dystrophy, Huntington disease, Friedreich ataxia, Prader-Willi syndrome, Werner syndrome, Cockayne syndrome, and others such as those indicated above.
Type 1 Diabetes: Insulin-Dependent Diabetes Mellitus (IDDM)
Etiology of Type 1 Diabetes
Type 1 diabetes (T1D) has been shown to be the result of an autoimmune reaction to antigens of the islet cells of the pancreas. There is a strong association between T1D and other endocrine autoimmunities (e.g. Addison disease). Additionally, there is an increased prevalence of autoimmune disease in family members of T1D patients.
Types of Autoantibodies
1. Islet cell cytoplasmic autoantibodies: The primary autoantibodies found in 90% of type 1 diabetics are against islet cell cytoplasmic proteins (termed ICCA, islet cell cytoplasmic autoantibodies). In non-diabetics ICCA frequency is only 0.5%–4%. The presence of ICCA is a highly accurate predictor of future development of T1D. ICCA are not specific for the β-cells and recognize antigens in other cell types in the islet. However, the autoimmune attack appears to selectively destroy β-cells. Therefore, the autoantibodies may play a primary role in the destruction of islet cells. It is an equally likely possibility that the production of anti-islet autoantibodies occurs as a result of the destruction of β-cells. Whether a direct cause or an effect of islet cell destruction, the titer of the ICCA tends to decline over time.
The most common cytoplasmic proteins to which autoantibodies are detected are glutamic acid decarboxylase (GAD), protein tyrosine phosphatase-like islet antigen 2 (identified as IA2 for insulinoma associated 2), insulin, and zinc transporter 8 (ZnT8). The function of the IA2 protein in islet cell function is currently not known. The IA2 protein is encoded by the PTPRN (protein tyrosine phosphatase receptor type N) gene. The ZnT8 protein is encoded by the SLC30A8 gene. ZnT8 is a zinc efflux transporter involved in the accumulation of zinc in intracellular vesicles. Both IA2 and ZnT8 are colocalized with insulin within insulin secretory vesicles in pancreatic β-cells.
The presence of IA2 is also correlated with obesity-induced type 2 diabetes.
2. Islet cell surface antibodies: Autoantibodies directed against cell-surface antigens (ICSA) have also been described in as many as 80% of type 1 diabetics. Similar to ICCA, the titer of ICSA declines over time. Some patients with type 2 diabetes have been identified that are ICSA positive.
3. Specific antigenic targets of islet cells: Antibodies to glutamic acid decarboxylase (GAD) have been identified in over 80% of patients newly diagnosed with IDDM. Like ICCA, anti-GAD antibodies decline over time in type 1 diabetics. There are two GAD genes in humans identified as GAD1 and GAD2. The GAD isoforms produced by these two genes are identified as GAD67 (GAD1 gene: GAD67) and GAD65 (GAD2 gene: GAD65) which is reflective of their molecular weights. Both the GAD1 and GAD2 genes are expressed in the brain and GAD2 expression also occurs in the pancreas. The presence of anti-GAD antibodies (both anti-GAD65 and anti-GAD67) is a strong predictor of the future development of IDDM in high-risk populations.
4. Anti-insulin antibodies (IAA) have been identified in T1D patients and in relatives at risk to develop T1D. These IAA are detectable even before the onset of insulin therapy in type 1 diabetics. IAA are detectable in around 40% of young children with T1D.
Pathophysiology of Type 1 Diabetes
The autoimmune destruction of pancreatic β-cells leads to a deficiency of insulin secretion. It is this loss of insulin secretion that leads to the metabolic derangements associated with type 1 diabetes. In addition to the loss of insulin secretion, the function of pancreatic α-cells is also abnormal. Of significance to the pathology of type 1 diabetes is the observation that α-cell responses to hypoglycemia are often impaired, yet the responses of α-cells to serum amino acids is normal. Nonetheless, administration of insulin to type 1 diabetics can lead to severe hypoglycemia as a result of these altered responses of α-cells to hypoglycemia.
Although the responses of the α-cells to hypoglycemia are impaired in type 1 diabetes there is, nonetheless, excessive secretion of glucagon in these patients. Normally, hyperglycemia leads to reduced glucagon secretion. However, in patients with T1D, glucagon secretion is not suppressed by hyperglycemia. The resultant inappropriately elevated glucagon levels exacerbates the metabolic defects due to insulin deficiency (see below). The most pronounced example of this metabolic disruption is that patients with T1D rapidly develop diabetic ketoacidosis in the absence of insulin administration. If somatostatin is administered to suppress glucagon secretion, there is a concomitant suppression in the rise of glucose and ketone bodies. Particularly problematic for long term T1D patients is an impaired ability to secrete glucagon in response to hypoglycemia. This leads to potentially fatal hypoglycemia in response to insulin treatment in these patients.
Although insulin deficiency is the primary defect in T1D, in patients with poorly controlled T1D there is also a defect in the ability of target tissues to respond to the administration of insulin. There are multiple biochemical mechanisms that account for this impairment of tissues to respond to insulin. Deficiency in insulin leads to elevated levels of free fatty acids in the plasma as a result of uncontrolled lipolysis in adipose tissue. Free fatty acids suppress glucose metabolism in peripheral tissues such as skeletal muscle. This impairs the action of insulin in these tissues, i.e. the promotion of glucose utilization. Additionally, insulin deficiency decreases the expression of a number of genes necessary for target tissues to respond normally to insulin such as glucokinase in liver and the GLUT4 class of glucose transporters in adipose tissue and skeletal muscle. The major metabolic derangements which result from insulin deficiency in T1D are impaired glucose, lipid, and protein metabolism.
Glucose Metabolism: Uncontrolled T1D leads to increased hepatic glucose output. First, liver glycogen stores are mobilized then hepatic gluconeogenesis is used to produce glucose. Insulin deficiency also impairs non-hepatic tissue utilization of glucose. In particular in adipose tissue and skeletal muscle, insulin stimulates glucose uptake. This is accomplished by insulin-mediated movement of glucose transporter proteins to the plasma membrane of these tissues. Reduced glucose uptake by peripheral tissues in turn leads to a reduced rate of glucose metabolism. In addition, the level of hepatic glucokinase is regulated by insulin. Therefore, a reduced rate of glucose phosphorylation in hepatocytes leads to increased delivery to the blood. Other enzymes involved in anabolic metabolism of glucose are affected by insulin (primarily through covalent modifications). The combination of increased hepatic glucose production and reduced peripheral tissues metabolism leads to elevated plasma glucose levels. When the capacity of the kidneys to absorb glucose is surpassed, glucosuria ensues. Glucose is an osmotic diuretic and an increase in renal loss of glucose is accompanied by loss of water and electrolytes, termed polyuria. The result of the loss of water (and overall volume) leads to the activation of the thirst mechanism (polydipsia). The negative caloric balance which results from the glucosuria and tissue catabolism leads to an increase in appetite and food intake (polyphagia).
Lipid Metabolism: One major role of insulin is to stimulate the storage of food energy following the consumption of a meal. This energy storage is in the form of glycogen in hepatocytes and skeletal muscle. Additionally, insulin stimulates hepatocytes to synthesize triglycerides and storage of triglycerides in adipose tissue. In opposition to increased adipocyte storage of triglycerides is insulin-mediated inhibition of lipolysis. In uncontrolled type 1 diabetes there is a rapid mobilization of triglycerides leading to increased levels of plasma free fatty acids. The free fatty acids are taken up by numerous tissues (however, not the brain) and metabolized to provide energy. Free fatty acids are also taken up by the liver.
Normally, the levels of malonyl-CoA are high in the presence of insulin. These high levels of malonyl-CoA inhibit carnitine palmitoyltransferase 1 (CPT-1), the enzyme required for the transport of fatty acyl-CoA’s into the mitochondria where they are subject to oxidation for energy production. Thus, in the absence of insulin, malonyl-CoA levels fall and transport of fatty acyl-CoA’s into the mitochondria increases. Mitochondrial oxidation of fatty acids generates acetyl-CoA which can be further oxidized in the TCA cycle. However, in hepatocytes the majority of the acetyl-CoA is not oxidized by the TCA cycle but is metabolized into the ketone bodies, acetoacetate and β-hydroxybutyrate. These ketone bodies leave the liver and are used for energy production by the brain, heart and skeletal muscle. In T1D, the increased availability of free fatty acids and ketone bodies exacerbates the reduced utilization of glucose furthering the ensuing hyperglycemia. Production of ketone bodies, in excess of the organisms ability to utilize them leads to ketoacidosis. In diabetics, this can be easily diagnosed by smelling the breath. A spontaneous breakdown product of acetoacetate is acetone which is volatilized by the lungs producing a distinctive odor.
Normally, plasma triglycerides are acted upon by lipoprotein lipase (LPL), an enzyme on the surface of the endothelial cells lining the vessels of adipose tissue, the heart, and skeletal muscle. In particular, LPL activity allows fatty acids to be taken from circulating triglycerides for storage in adipocytes. The expression of LPL is regulated by insulin and in its absence a hypertriglyceridemia results.
Protein Metabolism: Insulin regulates the synthesis of many genes, either positively or negatively that then affect overall metabolism. Insulin has a global effect on protein metabolism, increasing the rate of protein synthesis and decreasing the rate of protein degradation. Thus, insulin deficiency will lead to increased catabolism of protein. The increased rate of proteolysis leads to elevated concentrations in plasma amino acids. These amino acids serve as precursors for hepatic and renal gluconeogenesis. In liver, the increased gluconeogenesis further contributes to the hyperglycemia seen in T1D.
Genetics of Type 1 Diabetes
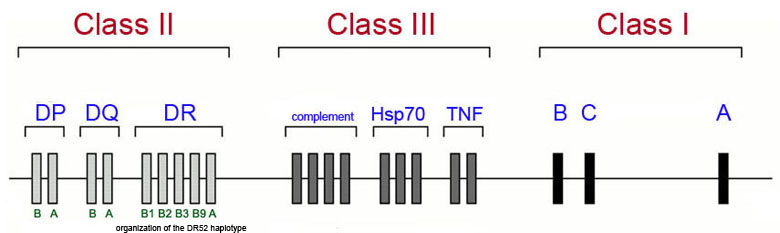
The majority of genetic loci associated with the development of type 1 diabetes map to the human leukocyte antigen (HLA) class II proteins which are encoded for by genes in the major histocompatibility complex (MHC) which is located on chromosome 6p21. The Figure below diagrams a simplified view of the MHC cluster which spans 3.5 megabases of chromosome 6 and encompasses over 200 genes divided into three subregions termed class I, class II and class III.
This is not to say that all genetic associations in T1D are due to mutations in HLA genes as more than 40 additional T1D susceptibility loci have been identified that are not HLA genes. The most frequently observed non-HLA genes associated with T1D are the genes encoding insulin (INS), protein tyrosine phosphatase, non-receptor type 22 (PTPN22), cytotoxic T-lymphocyte-associated protein 4 (CTLA4), interleukin-2 receptor alpha (IL2RA), and interferon-induced with helicase C domain 1 (IFIH1). Mutations in the INS gene are also associated with MODY10.
The INS gene is on chromosome 11p15.5, the PTPN22 gene is on chromosome 1p13, the CTLA4 gene is on chromosome 2q33, the IL2RA gene is on chromosome 10p15.1, and the IFIH1 gene is on chromosome 2q24.
Polymorphisms in the INS gene account for approximately 10% of genetic susceptibilities to T1D. All of the INS gene polymorphisms reside outside the coding region of the gene indicating that susceptibility to T1D is related to modulation of expression of the INS gene.
The PTPN22 gene encodes a protein identified as lymphoid-specific phosphatase (LYP) which is involved in the prevention of spontaneous T cell activation. One of the polymorphisms in the PTPN22 gene that is associated with T1D susceptibility is also associated with other autoimmune diseases such as systemic lupus erythematosus (SLE), Graves disease, and rheumatoid arthritis (RA).
The protein encoded by the CTLA4 gene is also involved in regulating T cell activation and like polymorphisms in the PTPN22 gene, polymorphisms in CTLA4 are associated with other autoimmune disorders such as Addison disease and Graves disease.
The IFIH1 encoded protein functions as a sensor for the presence of dsRNA from either a viral or and endogenous source. The consequence of the sensing of dsRNA by the IFIH1 protein is the activation of a type I interferon (IFN-I) antiviral response. Although there has not been a viral infection of pancreatic islets identified that is associated with type 1 diabetes, in experiments in mice where the IFIH1 gene has been knocked-out, there is a prevention against spontaneous autoimmune diabetes in non-obese diabetic mice.
The highest risk population for the development of T1D are children born with the HLA DR3/4–DQ8 serotype allele which accounts for almost 50% of all children who develop antibodies against pancreatic islet cells and thus, develop T1D by the age of 5.
HLA DR serotype alleles are molecules that recognize different DR gene products. The DR3 serotype recognizes the DRB1*03 gene products and the DR4 serotype recognizes the DRB1*04 gene products. Children with the high risk HLA alleles DR3/4–DRQ or DR4/DR4, and who have a family history of T1D, have a nearly 1 in 5 chance of developing islet cell autoantibodies resulting in T1D. These same children born into a family with no history of T1D still have a 1 in 20 chance of developing T1D.
It should be pointed out that although there are these strong genetic associations to T1D, over 85% of all children who develop the disease do not have a family history associated with T1D. The class II HLA molecules that are associated with increased risk of T1D have been shown to bind peptides derived from the currently identified autoantigens described above and present these peptides to CD4+ T cells which then activate CD8+ cytotoxic T cells resulting in killing of islet β cells.
Type 2 Diabetes: Non-Insulin-Dependent Diabetes Mellitus (NIDDM)
Etiology of Type 2 Diabetes
Type 2 diabetes (T2D) is characterized by a lack of the need for insulin to prevent ketoacidosis. Type 2 diabetes refers to the common form of idiopathic NIDDM. Type 2 diabetes is not an autoimmune disorder, however, there is a strong genetic correlation to the susceptibility to this form of diabetes. The susceptibility genes that predispose one to T2D have not been identified in most patients. This is due in part to the heterogeneity of the genes responsible for the susceptibility to T2D. Obesity is a major risk factor that predisposes one to T2D. Genetic studies in mice and rats have demonstrated a link between genes responsible for obesity and those that cause diabetes mellitus.
Pathophysiology of Type 2 Diabetes
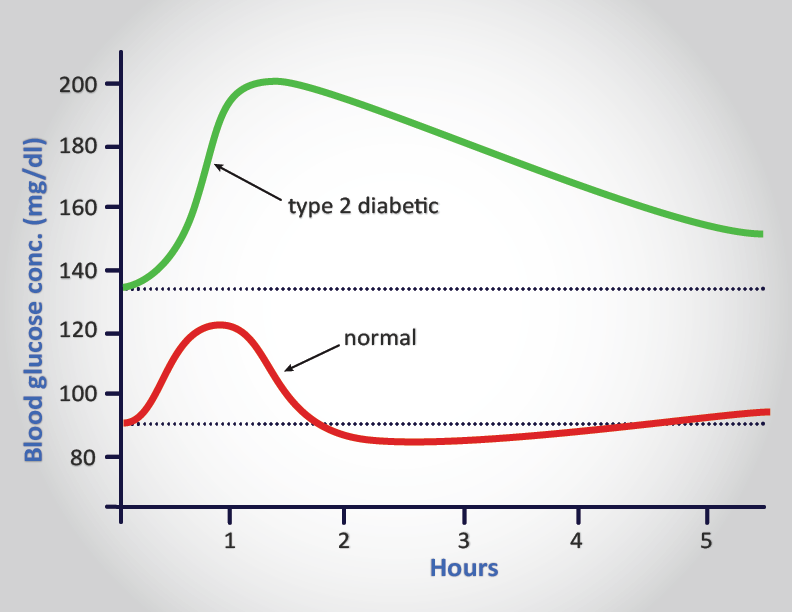
Unlike patients with type 1 diabetes, those with type 2 diabetes have detectable levels of circulating insulin. On the basis of oral glucose tolerance testing the essential elements of T2D can be divided into 4 distinct groups; those with normal glucose tolerance, chemical diabetes (called impaired glucose tolerance), diabetes with minimal fasting hyperglycemia (fasting plasma glucose <140 mg/dL), and diabetes mellitus in association with overt fasting hyperglycemia (fasting plasma glucose >140 mg/dL). In patients with the highest levels of plasma insulin (impaired glucose tolerance group) there was also elevated plasma glucose. This indicates that these individuals are resistant to the action of insulin. In the progression from impaired glucose tolerance to diabetes mellitus the level of insulin declines indicating that patients with type 2 diabetes have decreased insulin secretion.
Additional studies have subsequently demonstrated that both insulin resistance and insulin deficiency is common in the average type 2 diabetic patient. Many experts conclude that insulin resistance is the primary cause of T2D, however, others contend that insulin deficiency is the primary cause because a moderate degree of insulin resistance is not sufficient to cause T2D. As indicated above, most patients with the common form of T2D have both defects.
The major clinical complications of T2D are the result of persistent hyperglycemia which leads to numerous pathophysiological consequences. As the glucose level rises in the blood the blood becomes more viscous which makes circulation of the blood in the small capillaries difficult. The reduced circulation results in progressive vascular complications leading to diabetic retinopathy (referred to as diabetic blindness), peripheral neuropathy (resulting in numbness in the extremities and tingling in fingers and toes), poor wound healing, and erectile dysfunction. In addition to these major clinical complications, the body reacts by increasing the level of glucose excretion by the kidneys leading to frequent urination which is called polyuria. As the glucose is excreted there is a concomitant loss of water to maintain normal osmolarity of the urine. The water loss leads to excessive thirst called polydypsia.
Advanced Glycation End-Products (AGE)
Chronic hyperglycemia, such as in T2D, promotes a pro-inflammatory state that contributes to the glycation (non-enzymatic attachment of glucose) of proteins and lipids. These glycated macromolecules are referred to as advanced glycation end-products (AGE). One of the most significant glycated proteins in diabetes is hemoglobin. Glycated hemoglobin is identified as HbA1c, most often simplified to A1c.
Numerous pathological consequences result from the presence of AGE and include enhanced oxidative stress, oxidation of LDL (oxLDL), induced secretion of various pro-inflammatory cytokines, inhibition of the dilating effects of nitric oxide (NO), increased vascular permeability, and arterial stiffening.
A receptor that binds AGE is present in the plasma membrane of numerous cell types including immune cells, vascular endothelial cells, and smooth muscle cells. This receptor was originally identified as Receptor for Advanced Glycation End-products (RAGE). RAGE is a member of the human class J scavenger receptor family (specifically SCARJ1). This receptor is encoded by the AGER (advanced glycosylation end-product specific receptor) gene.
Measurement of HbA1c Levels
The development of hypoglycemia inducing drugs is the major pharmacological focus of type 2 diabetes therapies. Assessment of therapeutic efficacy in the treatment of the hyperglycemia in T2D is accomplished by routine measurement of the circulating levels of glycated hemoglobin, designated as the level of HbA1c, often designated as just A1c. Glycation of hemoglobin (as well as numerous other proteins and macromolecules) occurs as a result of non-enzymatic covalent sugar attachment to the proteins of hemoglobin. Glycation can involve fructose or glucose but in the context of hemoglobin glycation it is almost exclusively glucose that is attached to the hemoglobin proteins. Glycation of hemoglobin is sometimes referred to as glycosylation but it is a non-enzymatic attachment of the sugar so the use of the term glycosylated hemoglobin is incorrect as it infers an enzyme catalyzed reaction.
HbA1 is the major form of adult hemoglobin in the blood and the “c” refers to the glycated form of the protein. Since hemoglobin is present in red blood cells and these cells have a limited life span of 120 days in the circulation, measurement of HbA1c levels is a relatively accurate measure of the amount of glucose in the blood and the length of time the level has been elevated. Typical values for HbA1c measurement (using the previous standard Diabetes Control and Complications Trial, DCCT units of %) are shown in the Table below. The normal range of HbA1c in the DCCT units of % is 4%–5.6%. Values of HbA1c of 5.7%–6.4% are considered pre-diabetic values and values greater than 6.5% define diabetes.
Beginning in 2011 a new international standard (International Federation of Clinical Chemistry, IFCC units) for the measurement of HbA1c levels began to be utilized although in the US the old DCCT values are still the most commonly used. The new IFCC standard equates the mmole of HbA1c per mole of total measured hemoglobin, Hb (mmol/mol). The method for calculating the relationship between these two measurement values is to use the following formula:
IFCC-HbA1c (mmol/mol) = [DCCT-HbA1c (%) – 2.15] × 10.929.
To calculate the estimated average glucose (eAG) level in the blood using the DCCT (%) values one would use the following formula:
eAG (mg/dl) = 28.7 × A1C − 46.7 (for glucose level in mM use: eAG (mM) = 1.59 × A1C − 2.59
With new IFCC standard the target range of HbA1c for normal healthy levels is 20–38mmol/mol.
| HbA1c | HbA1c/Hb mmol/mol | eAG (mg/dl) | eAG (mM) |
| 4% | 20 | 68 | 3.8 |
| 5% | 31 | 97 | 5.4 |
| 6% | 42 | 125 | 7 |
| 7% | 53 | 154 | 8.5 |
| 8% | 64 | 183 | 10 |
| 9% | 75 | 212 | 11.7 |
| 10% | 86 | 240 | 13.3 |
| 11% | 97 | 270 | 15 |
| 12% | 108 | 298 | 16.5 |
| 13% | 119 | 326 | 18 |
| 14% | 130 | 355 | 19.7 |
Genetics of Type 2 Diabetes
Development of type 2 diabetes is the result of multifactorial influences that include lifestyle, cardiometabolic phenotypes, environment, and genetics. The disease arises when insulin resistance-induced compensatory insulin secretion is exhausted. A high-caloric diet coupled with a sedentary lifestyle are the major contributing factors in the development of the insulin resistance and pancreatic β-cell dysfunction. However, a predisposing genetic background has long been suspected in playing a contributing role in the development of type 2 diabetes.
By using whole-genome linkage analysis the entire genome of affected family members can be scanned and the family members monitored over several generations. In addition, large numbers of affected sibling-pairs can also be studied. Using these genome-wide linkage methods the first major susceptibility locus for type 2 diabetes was located on chromosome 2 in 1996. This locus was designated NIDDM1. The first gene identified in the NIDDM1 locus with polymorphisms correlated to type 2 diabetes susceptibility was calpain 10 (CAPN10).
CAPN10 is a calcium-activated neutral protease that is a member of the calpain-like cysteine protease family. The CAPN10 gene is located on chromosome 2q37.3 and spans 31 kb composed of 15 exons encoding a 672 amino acid protein. Variation in the non-coding region of the CAPN10 gene is associated with a threefold increased risk of type 2 diabetes in Mexican Americans. However, in European populations polymorphisms in CAPN10 are less contributory to type 2 diabetes than other recently discovered genes. Genetic variants in CAPN10 may alter insulin secretion or insulin action as well as the production of glucose by the liver. Recent studies indicate that CAPN10 may have a critical role in the survival of pancreatic β-cells.
Another early genetic marker for type 2 diabetes was hepatocyte nuclear factor 4-α (HNF4A). Note that HNF4A is also known to be associated with the development of MODY1. The hepatocyte nuclear factor family of proteins was first identified as an abundant class of transcription factors in the liver. In addition to the liver, HNF4A is expressed in pancreatic β-cells, kidneys and intestines. As indicated above, mutations in HNF4A can cause MODY1 which is characterized by a normal response to insulin but an impaired insulin secretory response in the presence of glucose.
The HNF4A gene maps to a region of chromosome 20 that has been linked to type 2 diabetes. Specifically the HNF4A gene is located on chromosome 20q13.12 and is composed of 13 exons that generate 10 alternatively spliced mRNAs. Single nucleotide polymorphisms (SNPs) in the HNF4A gene have an impact on pancreatic β-cell function leading to altered insulin secretion and result in the development of MODY1. The SNPs in the HNF4A gene that are related to development of type 2 diabetes lie in a promoter element called P2. The P2 promoter is used primarily in pancreatic β-cells, whereas, both the P1 and P2 promoters are used in liver cells. The P2 promoter is a binding site for the transcription factors HNF-1α (HNF1A), HNF-1β (HNF1B), and insulin promoter factor-1 (IPF1). As described above, alteration in the function of each of these latter three transcription factors is associated with various forms of MODY.
Recent evidence has demonstrated a role for a member of the nuclear hormone receptor superfamily of proteins in the etiology of type 2 diabetes. The thiazolidinedione (TZD) class of drugs, used to increase the sensitivity of the body to insulin (see below), bind to and alter the function of the peroxisome proliferator-activated receptor-γ, PPARγ. PPARγ is also a transcription factor and, when activated, binds to another transcription factor known as the retinoid X receptor, RXR. When these two proteins interact they bind to specific PPAR response elements (termed PPREs) in target genes thereby regulating their expression. PPARγ is a key regulator of adipocyte differentiation; it can induce the differentiation of fibroblasts or other undifferentiated cells into mature fat cells. PPARγ is also involved in the synthesis of biologically active compounds from vascular endothelial cells and immune cells. Mutations in the gene for PPARγ (gene symbol = PPARG) have been correlated with insulin resistance.
More recent genome-wide association studies (GWAS) have identified single nucleotide variants (SNV; also referred to as polymorphisms, SNP) that are highly associated with type 2 diabetes have identified at least 1289 association signals that map to 611 distinct loci. With the advent of technologies to rapidly knockout genes in embryonic stem cells it has become possible to validate candidate T2D-associated genes for their role(s) in insulin production and/or pancreatic β-cell viability.
The Table below lists several genes that either, reside within chromosomal loci that are highly correlated to the development of type 2 diabetes, or that have had polymorphisms (SNV) identified in the gene itself that correlate to development of type 2 diabetes. Included in the Table are PPARG and CAPN10 described above as well as the gene potassium inwardly-rectifying channel, subfamily J, member 11 (KCNJ11) which is described in the Insulin Function, Insulin Resistance, and Food Intake Control of Secretion page.
The transcription factor TCF7L2 (transcription factor 7-like 2, T-cell specific HMG-box) is one of four TCF proteins involved in the signaling pathways initiated by the Wnt family of secreted growth factors. Two SNPs identified in the TCF7L2 gene are the most highly correlated polymorphisms with type 2 diabetes. Given that evidence is accumulating that Wnt and insulin signaling pathways exhibit cross-talk at the level of both the gut and the pancreas, it is likely that new targets in the treatment of type 2 diabetes will involve the interrelationships between these two factors.
Table of Several Type 2 Diabetes Susceptibility Genes
| Gene Name | Gene Symbol | Gene Function, Comments | Disease Mechanism |
| ATP binding cassette subfamily C member 8 | ABCC8 | subunit of the ATP-sensitive potassium (KATP) channel involved in insulin secretion; protein is also called sulfonylurea receptor (SUR1); the KATP channel is a heterooctameric complex formed from four subunits from the ABCC8 (SUR1) encoded protein and four subunits of the KCNJ11 encoded protein | β-cell dysfunction |
| a disintegrin-like and metalloproteinase (ADAM) with thrombospondin type 1 motif, 9 | ADAMTS9 | proteolytically cleaves the large extracellular matrix proteoglycans aggrecan and versican | unknown |
| apolipoprotein E (ApoE) | APOE | component of lipoprotein particles including chylomicrons, VLDL, IDL, and HDL | sensitizes β-cells to lipids; loss or reduced expression leads to decreased insulin |
| Ca2+/calmodulin-dependent protein kinase 1-δ | CAMK1D | leads to activation of extracellular signal-regulated protein kinase 1 (ERK1) activity | β-cell dysfunction |
| calpain 10 | CAPN10 | calcium-activated neutral protease, member of the calpain-like cysteine protease family | glucose transport |
| cell division cycle 123 homolog | CDC123 | required for entry into S-phase of cell cycle; CDC123 is in the same chromosomal region as the CAMK1D gene | β-cell dysfunction |
| cyclin-dependent kinase-5 regulatory subunit associated protein 1-like 1 | CDKAL1 | inhibitor of cyclin-dependent kinase 5 (CDK5) | β-cell dysfunction, impaired insulin secretion |
| cyclin-dependent kinase inhibitor 2A | CDKN2A/B | the CDKN2A gene produces 2 major proteins: p16(INK4), which is a cyclin-dependent kinase inhibitor, and p14(ARF), which binds the p53-stabilizing protein MDM2, p14 is also called CDKN2B | β-cell dysfunction |
| cordon-bleu WH2 repeat protein like 1 | COBLL1 | precise function unknown | impaired β-cell differentiation |
| ceruloplasmin | CP | associated with insulin production | impaired insulin production and β-cell dysfunction |
| dehydrogenase/reductase 2 | DHRS2 | member of the short-chain dehydrogenases/reductases (SDR) family of enzymes; mediates inhibition of cell growth | impaired β-cell responses to fatty acids |
| fat mass- and obesity-associated gene | FTO | is a member of the ALKB homolog (ALKBH) family and is identified as ALKBH9; catalyzes the 2-oxoglutarate and Fe2+-dependent demethylation of N6-methyladenosine in mRNA; expression upregulated in hypothalamus in response to food intake; increased expression in hypothalamus regulates energy intake but does not affect feeding reward circuits | obesity |
| glucokinase regulatory protein | GCKR | binds to glucokinase and keeps the enzyme in the nucleus in the fasted state | β-cell dysfunction, impaired insulin secretion |
| glucose-dependent insulinotropic peptide (GIP) receptor | GIPR | Gs-type G-protein coupled receptor (GPCR) for GIP | impaired β-cell differentiation |
| GLIS family zinc finger 3 | GLIS3 | member of the C2H2-type zinc finger domain family of transcription factors; involved in the development of pancreatic β-cells | β-cell dysfunction |
| glucagon-like peptide 1 (GLP-1) receptor | GLP1R | Gs-type G-protein coupled receptor (GPCR) for GLP-1; enhances pancreatic β-cell survival; enhances insulin secretion | impaired β-cell function |
| glutathione S-transferase alpha 2 | GSTA2 | catalyzes the conjugation of glutathione to several substrates | impaired insulin production and β-cell dysfunction |
| hematopoietically expressed homeobox | HHEX | is a transcriptional repressor in liver cells, may be involved in the differentiation and/or maintenance of the differentiated state in hepatocytes, is a target of the Wnt signaling pathway | β-cell dysfunction, impaired insulin secretion |
| hepatocyte nuclear factor-1α | HNF1A | mutations in gene associated with MODY3 | impaired insulin production and impaired β-cell responses to glucose |
| hepatocyte nuclear factor-1β | HNF1B | mutations in gene associated with MODY5 | unknown |
| hepatocyte nuclear factor-4α | HNF4A | mutations in gene associated with MODY1; functions as a transcriptional repressor in β-cells | impaired insulin production and impaired β-cell responses to glucose |
| huntingtin | HTT | regulation of transcription factor activities; interacts with multiple proteins involved in synaptic vesicle exocytosis and recycling | impaired β-cell responses to fatty acids |
| insulin degrading enzyme | IDE | is an extracellular thiol metalloprotease with preference for insulin, also degrades amyloid-β protein; the IDE gene resides within the same chromosomal locus as HHEX | β-cell dysfunction |
| insulin-like growth factor-2 mRNA binding protein 2 | IGF2BP2 | is an RNA-binding protein that recruits mRNAs for transport and storage; binds to the IGF2 mRNA | β-cell dysfunction |
| juxtaposed with another zinc-finger gene 1: TAK1(TGFβ-activated kinase-1)-interacting protein 27 | JAZF1 also called TIP27 | functions as a transcriptional repressor, exhibits antiapoptotic activity | β-cell dysfunction |
| potassium inwardly-rectifying channel, subfamily J, member 11 | KCNJ11 | pore-forming α-subunit of the ATP-sensitive potassium (KATP) channel involved in insulin secretion; protein is also called Kir6.2; heterooctameric complex formed from four subunits of the KCNJ11 encoded protein and four subunits from the ABCC8 (SUR1) encoded protein; mutations in KCNJ11 gene are associated with the very rare form of monogenic diabetes: MODY13 | β-cell dysfunction |
| potassium channel, voltage-gated, KQT-like subfamily, member 1 | KCNQ1 | pore-forming α-subunit; forms a heteromeric complex with the regulatory β-subunit encoded by the KCNE1 gene; can also form heteromeric complexes with the KCNE3 regulatory subunit; constitutes the delayed rectifier IKs potassium current that contributes to the latter part of the repolarization (phase 3) of ventricular cardiomyocyte action potential propagation; inactivating mutations in gene associated with long QT syndrome (LQTS) type 1 hence the gene is also known as KvLQT1; gain-of-function mutations associated with short QT syndrome (SQTS) variant 2; expression regulated by tissue specific imprinting; gene also expressed in epithelial cells of the exocrine and endocrine pancreas; protein is also known as Kv7.1 | β-cell dysfunction |
| Krüppel-like factor 14 | KLF14 | Krüppel-like transcription factors all related to Drosophila Krüppel gene; are a family of zinc-finger transcription factors; KLF14 is a master trans regulator of adipose gene expression | |
| leucine-rich repeat containing G-protein coupled receptor 5 | LGR5 | gene is predominantly expressed in the cycling crypt base of the columnar cells of the gut and hair follicle, protein is a glycoprotein that associates with integrins, the gene is a marker for intestinal adult stem cells, is a receptor for R-spondin proteins (four in protein family) that are agonists of canonical Wnt signaling; unlike classic GPCR proteins, LGR5 does not activate a heterotrimeric G-protein | β-cell dysfunction |
| melanocortin 4 receptor | MC4R | is a single exon (intronless) gene, mutations in this gene are the most frequent genetic cause of severe obesity, receptor binds α-melanocyte stimulating hormone (α-MSH) | obesity |
| melatonin receptor 1B | MTNR1B | high affinity G-protein coupled receptor (GPCR) that binds melatonin; coupled to Gi-type G-protein; expressed primarily in pancreatic β-cells | β-cell dysfunction, impaired insulin secretion |
| Notch homolog 2 | NOTCH2 | one of three mammalian homologues of the Notch gene of fruit flies (Drosophila melanogaster) which regulates cellular differentiation | unknown |
| purinergic receptor P2Y1 | P2RY1 | member of the P2Y class of GPCR; binds ADP; coupled to a Gq-type G-protein; signal transduction pathway regulates the secretion of insulin | impaired insulin secretion |
| peptidylglycine alpha-amidating monooxygenase | PAM | multi-functional enzyme harboring a peptidylglycine alpha-hydroxylating monooxygenase (PHM) domain and a peptidyl-alpha-hydroxyglycine alpha-amidating lyase (PAL) domain; involved in the regulation of glucose-dependent insulin secretion | β-cell dysfunction |
| proprotein convertase subtilisin/kexin type 1 (PCSK1) inhibitor | PCSK1N | inhibits the activity of PCSK1 which is a protease involved in the processing of insulin | impaired insulin production and impaired β-cell responses to glucose |
| pancreatic and duodenal homeobox 1 (PDX1); also known as homeodomain transcription factor insulin promoter factor-1 (IPF-1) | PDX1 | transcriptional activator of several genes including those encoding insulin, glucokinase, and glucose transporter type 2 (GLUT2); also is a key regulator of the development of the pancreas, most probably by determining maturation and differentiation of common pancreatic precursor cells in the developing gut | β-cell dysfunction |
| peroxisome proliferator-activated receptor-γ (PPARγ) | PPARG | transcriptional co-activator with retinoid X receptors (RXR), master regulator of adipogenesis, activation of adipocyte differentiation leads to increased fat storage and secretion of insulin-sensitizing adipocytokines such as adiponectin | insulin sensitivity |
| solute carrier family 16 (monocarboxylate transporter), member 11 (also known as MCT11) | SLC16A11 | plasma membrane transport of pyruvate into cells | |
| solute carrier family 30 (zinc transporter), member 8 | SCL30A8 | permits cellular efflux of zinc | β-cell dysfunction |
| transgelin 3 | TAGLN3 | member of a family of actin-binding proteins that are involved in regulating cellular migration, proliferation, and apoptosis | impaired β-cell responses to fatty acids |
| transcription factor 7-like 2 (T-cell specific HMG-box) | TCF7L2 | one of four TCF transcription factor proteins involved in the signaling pathways initiated by the Wnt family of secreted growth factors, polymorphisms in this gene have the highest correlation to type 2 diabetes | β-cell dysfunction, impaired insulin secretion |
| thyroid adenoma-associated gene | THADA | protein contains an ARM repeat (ARM = armadillo which is a fruit fly (Drosophila melanogaster) gene involved in segment polarity), the ARM repeat is involved in protein-protein interactions | unknown |
| transducin-like enhancer protein 4 | TLE4 | transcriptional corepressor; functions as a tumor suppressor | impaired β-cell differentiation |
| transmembrane and coiled-coil domain family 2 | TMCC2 | endoplasmic reticulum (ER)-localized protein involved in ER stress responses; may be involved in processing of amyloid precursor protein (APP) | impaired β-cell responses to fatty acids |
| tetraspanin 8 | TSPAN8 | tetraspanins are proteins that contain four transmembrane domains; this gene and LGR5 are found in the same chromosomal region; enhances cell-cell adhesion and proliferation; defects in protein function involved in tumor cell metastasis | β-cell dysfunction |
| WD repeat domain 13 | WDR13 | the WD repeat is a domain of approximately 40 amino acids that ends with a tryptophan-aspartate (WD) dipeptide; the WD repeat functions as a protein-protein or protein-DNA interaction domain; WDR13 functions as a transcriptional activator in the presence of the MAK kinase, JNK | impaired β-cell responses to fatty acids |
| Wolfram syndrome gene; also called diabetes insipidus, diabetes mellitus, optic atrophy, and deafness (DIDMOAD) | WFS1 | is an integral endoplasmic reticulum (ER) membrane glycoprotein, associates with the C-terminal domain of the ER-localized Na+/K+ATPase β-1 subunit (ATP1B1) | β-cell dysfunction |
Neonatal Diabetes
Neonatal diabetes refers to a circumstance in which hyperglycemia results from dysfunction in insulin action within the first 6 months of life. This form of diabetes is not typical type 1 diabetes (T1D, or juvenile onset diabetes) since T1D involves immune destruction of the pancreatic β-cells and thus, requires several years to fully develop. Neonatal diabetes can be transient or permanent. If an infant suffers from the transient form they are at increased risk for developing full-blown later in life.
The advent of genetic studies to identify HLA haplotypes associated with the risk of development of T1D as well as the description of several T1D-associated autoantibodies provided the foundation for characterization of the clinical features of the disease in newborns. Evidence is clear that the etiology of diabetes in the first year of life is different from that of the autoimmune forms of T1D more classically diagnosed when children are older. As indicated, the presentation of diabetes in infants prior to 6-months of age can be transient or permanent. The permanent form of the disease is termed Permanent Neonatal Diabetes Mellitus (PNDM). PNDM is a rare event occurring with a frequency of approximately 2 cases per 100,000 births.
Definitive determination of PNDM requires early gene screening as soon as symptoms manifest. This allows for a differential diagnosis to be made as to whether or not the symptoms can be expected to be transient or permanent. Very low birth weight is highly correlated to PNDM and is associated with fetal lack of insulin. The most prominent of symptoms is the onset of hyperglycemia within the first 6 months after birth. Affected infants do not secrete insulin in response to glucose or glucagon but will secrete insulin in response to tolbutamide administration. Tolbutamide is a drug of the sulfonylurea class used to treat type 2 diabetes. Many infants will exhibit similar neurologic abnormalities, including developmental delay, muscle weakness, and epilepsy. In patients manifesting with neurologic abnormalities there are often associated dysmorphic features, including prominent metopic suture (persistence of the space between the frontal bones of the skull), a downturned mouth, bilateral ptosis (drooping eyelid), and limb contractures.
Early on it was thought that the underlying defect resulting in neonatal diabetes was pancreatic β-cell dysfunction or a defect in β-cell maturation. However, genetic evidence now indicates that neonatal diabetes, in particular PNDM, is the result of single-gene defects. This make PNDM a monogenic disorder. The disorder can be inherited although it is most often the result of a sporadic mutation in one of the parental gametes. Over the past decade at least 12 genes have been identified as being associated with the development of PNDM. The most commonly mutated genes are the potassium inwardly-rectifying channel, subfamily J, member 11 (KCNJ11), ATP-binding cassette transporter, subfamily C, member 8 (ABCC8), and insulin (INS) genes. The proteins of the KCNJ11 and ABCC8 genes form the ATP-sensitive potassium channel (KATP channel) that is involved in insulin secretion (see the Insulin Function, Insulin Resistance, and Food Intake Control of Secretion page). Mutations in the KCNJ11 gene are also associated with an increased risk for the development of T2D as described in the Genetics of Type 2 Diabetes section above. The insulin gene is one of the non-HLA genes that is mutated in T1D as indicated above in the Genetics of Type 1 Diabetes section.
Table of Neonatal Diabetes Susceptibility Genes
| Gene Name | Gene Symbol | Comments |
| ATP-binding cassette transporter, subfamily C, member 8 | ABCC8 | along with the KCNJ11 encoded protein ABCC8 forms the ATP-sensitive potassium (KATP) channel involved in insulin secretion; gene is also known as the sulfonylurea receptor: SUR1; diabetes due to ABCC8 mutations are dominant in inheritance; mutations in the ABCC8 gene found in 13% of PNDM cases; ABCC8 and KCNJ11 genes are both found at chromosome 11p15.1 |
| eukaryotic translation initiation factor 2-α kinase 3 | EIF2AK3 | also associated with skeletal dysplasia, intellectual impairment, and hepatic failure; gene also known as RNA-dependent protein kinase-like endoplasmic reticulum kinase, PERK; this particular form of PNDM is also known as Wolcott-Rallison syndrome (WRS) |
| forkhead box family member P3 | FOXP3 | is a member of the fork-winged helix family of transcription factors,; plays an important role in development and function of CD4-positive/CD25-positive regulatory T cells (Tregs); Tregs are involved in active suppression of inappropriate immune responses |
| GATA binding protein 6 | GATA6 | zinc finger family transcription factor; belongs to family of transcription factors defined by the presence of the consensus sequence WGATAR (W = T or A; R = G or A); mutations in gene associated with pancreatic agenesis, congenital cardiomyopathy, and biliary tract abnormalities |
| pancreatic glucokinase | GCK | same gene found associated with MODY2; homozygous mutations in GCK associated with PNDM |
| Gli similar (GLIS family) Krüppel-like zinc finger transcription 3 | GLIS3 | also associated with severe congenital hypothyroidism, cholestasis, congenital glaucoma, and polycystic kidneys; mutations in GLIS3 result in impaired endocrine pancreas development |
| hepatocyte nuclear factor 1β | HNF1B | mutations in gene associated with MODY5; mutations also associated with transient neonatal diabetes |
| insulin | INS | mutations in the INS gene represent 16% of PNDM cases; INS gene located at chromosome 11p15.5 which is close to both the ABCC8 and KCNJ11 genes that are located at 11p15.1 |
| potassium inwardly-rectifying channel, subfamily J, member 11 | KCNJ11 | pore-forming α-subunit of the ATP-sensitive potassium (KATP) channel of the ATP-sensitive potassium (KATP) channel involved in insulin secretion; protein is also called Kir6.2; heterooctameric complex formed from four subunits of the KCNJ11 encoded protein and four subunits from the ABCC8 (SUR1) encoded protein; diabetes due to KCNJ11 mutations are dominant in inheritance; both KCNJ11 and ABCC8 genes are located at chromosome 11p15.1 |
| pancreatic and duodenal homeobox 1 (PDX1); also known as homeodomain transcription factor insulin promoter factor-1 (IPF-1) | PDX1 | mutations in gene associated with MODY4; transcriptional activator of several genes including those encoding insulin, glucokinase, and glucose transporter type 2 (GLUT2); also is a key regulator of the development of the pancreas, most probably by determining maturation and differentiation of common pancreatic precursor cells in the developing gut |
| pancreas transcription factor 1A | PTF1A | gene is essential to normal pancreas formation; mutations in gene also associated with cerebellar hypoplasia/agenesis, and dysmorphism; similar phenotypes to those resulting from PDX1 mutations |
| regulatory factor x-box binding family transcription factor member 6 | RFX6 | involved in pancreatic islet cell differentiation; also associated with intestinal atresia and gall bladder hypoplasia |
| solute carrier family, facilitated glucose (GLUT) transporter subfamily, member 2 | SLC2A2 | encoded protein is GLUT2; mutations in gene are also associated with Fanconi-Bickel syndrome (was once called glycogen storage disease XI, GSD11 but term is no longer valid) |
| solute carrier family, folate/thiamine transporters subfamily, member 2 | SLC19A2 | mutations in gene result in thiamine-responsive megaloblastic anemia syndrome (also known as Rogers syndrome), defined by the occurrence of megaloblastic anemia, diabetes mellitus, and sensorineural deafness; thiamine treatment results in varying degrees of positive response |
Diabetes and the Metabolic Syndrome: MetS
Although the metabolic syndrome (also called syndrome X) is not exclusively associated with type 2 diabetes and the associated insulin resistance, the increasing prevalence of obesity and associated development of type 2 diabetes places insulin resistance as a major contributor to the syndrome. The metabolic syndrome is defined as a clustering of atherosclerotic cardiovascular disease risk factors that include visceral adiposity (obesity), insulin resistance, low levels of HDLs and a systemic proinflammatory state. There are key components to the metabolic syndrome which include in addition to insulin resistance (the hallmark feature of the syndrome), hypertension, dyslipidemia, chronic inflammation, impaired fibrinolysis, a procoagulant state, and most telling, central obesity. For more information on the biochemical and clinical aspects of MetS visit the Metabolic Syndrome page.
Mitochondrial Dysfunction in Type 2 Diabetes and Obesity
Well established data demonstrate that mitochondrial dysfunction, particularly as it relates to the processes of oxidative phosphorylation, is contributory to the development of encephalomyopathy, mitochondrial myopathy, and several age-related disorders that include neurodegenerative diseases, the metabolic syndrome, and diabetes. Indeed, with respect to diabetes, several mitochondrial diseases manifest with diabetic complications such as mitochondrial myopathy, encephalopathy, lactic acidosis, and stroke-like episodes (MELAS) and maternally inherited diabetes and deafness (MIDD).
Normal biogenesis of mitochondria is triggered in response to changes in the ATP/ADP ratio and to activation of AMPK which in turn results in increased expression of PPARγ co-activator 1α (PGC-1α) and nuclear respiratory factor-1 (NRF1). PGC-1α is a master transcriptional co-activator of numerous genes involved in mitochondrial biogenesis. NRF1 is a transcription factor that regulates the expression of mitochondrial transcription factor A (TFAM, for transcription factor A, mitochondrial; also designated mtTFA) which is a nuclear transcription factor essential for replication, maintenance, and transcription of mitochondrial DNA. NRF1 also controls the expression of nuclear genes required for mitochondrial respiration and heme biosynthesis. Evidence has shown that both PGC-1α and NRF1 expression levels are lower in diabetic patients as well as in non-diabetic subjects from families with type 2 diabetes. The expression of NRF1 is highest in skeletal muscle which is also the tissue that accounts for the largest percentage of glucose disposal in the body and, therefore, is the tissue that is most responsible for the hyperglycemia resulting from impaired insulin signaling.
Mitochondrial dysfunction results in increased production of ROS which activates stress responses leading to increased activity of MAPK and JNK. Both of these serine/threonine kinases phosphorylate IRS1 and IRS2 resulting in decreased signaling downstream of the insulin receptor. Inhibited IRS1 and IRS2 activity results in decreased activation of PI3K. PI3K activation is involved in the translocation of GLUT4 to the plasma membrane resulting in increased glucose uptake. Therefore, inhibition of PI3K results in reduced glucose uptake in skeletal muscle and adipose tissue. Mitochondrial dysfunction results in a reduction in the level of enzymes involved in β-oxidation leading to increases in intramyocellular lipid content. Indeed, skeletal muscle metabolism of lipids has been shown to be impaired in type 2 diabetics. An increased delivery of fatty acids to skeletal muscle, as well as diminished mitochondrial oxidation, results in increased intracellular content of fatty acid metabolites such as diacylglycerol (DAG), fatty acyl-CoAs, and ceramides. These metabolites of fatty acids are all known to induce the activity of protein kinase C isoforms (PKCβ and PKCδ) that phosphorylate IRS1 and IRS2 on serine residues resulting in impaired insulin signaling downstream of the insulin receptor.
Because skeletal muscle consumes the largest amount of serum glucose, mitochondrial dysfunction in this tissue will have the greatest impact on glucose disposal. However, adipose tissue also plays an important role in glucose homeostasis and mitochondrial dysfunction in this tissue has been shown to result in impaired glucose homeostasis resulting in diabetes. For example, when animals are treated with inhibitors of mitochondrial oxidation insulin-stimulated glucose uptake in adipose tissue is significantly impaired. Adipose tissue secretes a number of proteins classified as adipokines. Adiponectin is an adipokine that promotes insulin-sensitivity in insulin-responsive tissues, such as skeletal muscle. When plasma levels of adiponectin are measured in obese or type 2 diabetic subjects it is found to be significantly lower than in age and sex matched control subjects that are of normal weight or that do not have diabetes. In animal studies, the enhancement of adipocyte mitochondrial biogenesis results in increased adiponectin release from adipose tissue. Conversely, expression of adiponectin expression is decreased in adipocytes with mitochondrial dysfunction.
Given that impaired mitochondrial function is clearly associated with obesity and type 2 diabetes, it is not surprising that there is great interest in the use of pharmacology to augment mitochondrial function in the treatment of these disorders. Of significance is the fact that the thiazolidinedione (TZD) class of drugs used to treat the hyperglycemia of type 2 diabetes (see the next section) activate PPARγ which in turn increases the level of activity of PGC-1α. Although the TZDs were first marketed due to their ability to improve insulin sensitivity, they have since been shown to increase mitochondrial functions both in vitro and in vivo. Antioxidants have also been shown to enhance mitochondrial function by reducing the production of ROS. Resveratrol (found in grape skins and red wine) is a potent antioxidant whose activity is, in part, due to its ability to activate the deacetylase SIRT1 (see below). Activated SIRT1 deacetylates PGC-1α resulting in increased transcriptional activity and thus, enhanced mitochondrial biogenesis
Therapeutic Intervention for Hyperglycemia
Many, if not all, of the vascular consequences of insulin resistance are due to the persistent hyperglycemia seen in type 2 diabetes. For this reason a major goal of therapeutic intervention in type 2 diabetes is to reduce circulating glucose levels. There are many pharmacologic strategies to accomplish these goals.
Thiazolidinediones (TZD)
The TZDs, such as rosiglitazone (Avandia®) and pioglitazone (Actos®) have proven useful in treating the hyperglycemia associated with insulin-resistance in both type 2 diabetes and non-diabetic conditions. The TZDs function as agonists for the transcription factor, PPARγ. PPARγ is a member of the superfamily of nuclear receptor transcription factors. In addition to PPARγ there are the closely related members, PPARα and PPARβ/δ. PPARγ exists as a heterodimer with the nuclear retinoid X receptors, RXRs. The heterodimer binds to PPAR response elements (PPREs) in a number of target genes. Without ligand bound the heterodimer is associated with a co-repressor complex that includes a histone deacetylase. Deacetylated histone keeps DNA in a transcriptionally repressed state. When ligand binds to PPARγ the co-repressor complex dissociates and a co-activator complex containing histone acetyltransferase associates resulting in chromatin structural changes and transcriptional activation.
The net effect of the TZDs is a potentiation of the actions of insulin in liver, adipose tissue and skeletal muscle, increased peripheral glucose disposal and a decrease in glucose output by the liver. Genes shown to be affected by PPARγ action include those encoding glucokinase, GLUT4, malic enzyme, lipoprotein lipase, fatty acyl-CoA synthase, and adipocyte fatty acid binding protein (FABP4). PPARγ is primarily expressed in adipose tissue and thus it was at first difficult to reconcile how a drug that was apparently acting only in adipose tissue could lead to improved insulin sensitivity of other tissues. The answer to this question came when it was discovered that the TZDs stimulated the expression and release of the adipocyte hormone (adipokine), adiponectin.
Adiponectin stimulates glucose uptake and fatty acid oxidation in skeletal muscle. In addition, adiponectin stimulates fatty acid oxidation in liver while inhibiting expression of gluconeogenic enzymes in this tissue. These responses to adiponectin are exerted via activation of AMPK. The significance of PPARγ as a diabetes target is apparent not only from the observed effects of drugs that activate the receptor but also from genome wide screens showing that mutations in the PPARγ gene are correlated to familial insulin resistance.
Recent studies have identified a critical role for an enzyme (phosphatidic acid phosphatase, PAP1) involved in overall triglyceride and phospholipid homeostasis as a critical target of the PPARγ signaling pathway. In the yeast Saccharomyces cerevisiae, the PAP1 gene was identified as Smp2p and the encoded protein was shown to be the yeast ortholog of the mammalian protein called lipin-1. The lipin-1 gene (symbol: LPIN1) was originally identified in a mutant mouse called the fatty liver dystrophy (fld) mouse. The mutation causing this disorder was found to reside in the LPIN1 gene. There are three lipin genes in humans (LPIN1, LPIN2, and LPIN3) with the LPIN1 gene encoding three isoforms derived through alternative splicing. These three lipin-1 isoforms are identified as lipin-1α, lipin-1β, and lipin-1γ. Mutations in the LPIN2 gene are associated with Majeed syndrome which is characterized by chronic recurrent osteomyelitis, cutaneous inflammation, recurrent fever, and congenital dyserythropoietic anemia.
In addition to the obvious role of lipin-1 in triglyceride synthesis, evidence indicates that the protein is also required for the development of mature adipocytes, coordination of peripheral tissue glucose and fatty acid storage and utilization, and serves as a transcriptional co-activator. The latter functions of lipin-1 have obvious significance to diabetes as it has been shown that some of the effects of the TZD class of drugs are exerted via the effects of lipin-1. Although the lipin proteins do not contain DNA-binding motifs they have protein-interaction domains that allow them to form complexes with nuclear receptors and function as transcriptional regulators.
Lipin-1 has been shown to interact with peroxisome proliferator-activated receptor-γ [PPARγ] co-activator 1α (PGC-1α) and PPARα leading to enhanced gene expression. Lipin-1 also is known to interact with additional members of the nuclear receptor family including the glucocorticoid receptor (GR) and hepatocyte nuclear factor-4α (HNF-4α). Lipin-1 also induces the expression of the adipogenic transcription factors PPARγ and CCAAT-enhancer-binding protein α (C/EBPα).
The functions of lipin-1α and lipin-1β appear to be complimentary with respect to adipocyte differentiation. Lipin-1α induces genes that promote adipocyte differentiation while lipin-1β induces the expression of lipid synthesizing genes such as fatty acid synthase (FAS) and diacylglycerol acyltransferase (DGAT). The interactions of lipin-1 with PPARα and PGC-1α leads to increased expression of fatty acid oxidizing genes such as carnitine palmitoyltransferase-1 (CPT-1: encoded by the CPT1A gene), acyl-CoA oxidases (peroxisomal fatty acid oxidation pathway), and medium-chain acyl-CoA dehydrogenase (MCAD: encoded by the ACADM gene).
Targeting Glucagon-like Peptide-1 (GLP-1)
The synthesis and activities associated with GLP-1 are described in detail in the Gut-Brain Interrelationships page. As review, the primary metabolic responses to GLP-1 release from the enteroendocrine L-cells of the gut are inhibition of glucagon secretion and enhancement of glucose-dependent insulin release from the pancreas, both effects lead to decreased glycemic excursion. The hormonal action of GLP-1 is rapidly terminated as a consequence of enzymatic cleavage by dipeptidylpeptidase 4 (DPP4). Recent clinical evidence has shown that either infusion of GLP-1 or inhibition of DPP4 can result in dramatic reductions in fasting plasma glucose (FPG) concentrations, reductions in glycated hemoglobin (HbA1c) and improvement in pancreatic β-cell function. Thus, both represent potential targets for the prevention of the hyperglycemia associated with diabetes and impaired insulin function. For more information on the activities of DPP4 go to the DPP4 page.
There are advantages and disadvantages with the current therapeutic approaches to targeting GLP-1 action in diabetic patients. Current use of GLP-1 mimetics and/or GLP-1 receptor (GLP-1R) agonists focus on peptides or modified peptides and these must be injected. The need for chronic injection as a means of therapy always runs into the problem of patient compliance. Most of the drugs that have been developed as GLP-1 receptor agonists (GLP-1 mimetics) are given names that include the suffix “-glutide“.
Targeting Glucagon-like Peptide-1 Receptor (GLP-1R)
One of the first GLP-1R agonists approved for use was βYETTA® (also written as Byetta) developed by Amylin Pharmaceuticals and Eli Lilly and Co. Byetta is composed of exenatide which is a synthetic version of the lizard salivary peptide called exendin-4. Exenatide is 53% identical to GLP-1 at the level of amino acids and binds to and activates the GLP-1R. The advantage of exenatide as a therapeutic is that it is resistant to cleavage and inactivation by DPP4. In a recent trial in patients with type 2 diabetes, BYETTA was shown not only to lower blood glucose levels and HbA1c, but patients also had an associated weight loss. Another exenatide-related drug is Bydureon® which is a once-a-week injectable form of exenatide.
Another GLP-1R agonist is Victoza® (liraglutide) which was developed by Novo Nordisk. Victoza is a once-a-day injectable recombinant DNA produced modified GLP-1 protein complex. The protein is a fatty acid-linked derivative of human GLP-1 that is resistant to DPP4 cleavage. The 16-carbon fatty acyl-chain (palmitic acid) addition to the protein allows liraglutide to bind to albumin in the blood which prevents its excretion via the kidneys. Liraglutide has been shown to have a half-life of 11-13 hours making it ideal for once-a-day injection. Results of clinical studies demonstrated significant reductions in HbA1c levels in liraglutide treated patients. Liraglutide was approved for use in the United States in January 2010. One problematic side effect of liraglutide treatment is pancreatitis which occurs in patients with a higher frequency than with other diabetes treatments. A more recent addition to the GLP-1 receptor agonist family of diabetes drugs is Trulicity® (dulaglutide) manufactured by Eli Lilly and Co.
Currently there are seven GLP-1 receptor agonist drugs that have been approved for use in the treatment of type 2 diabetes in the US. However, GlaxoSmithKline voluntarily withdrew albiglutide from the market in 2018 for economic reasons. In early 2019 Novo Nordisk filed with the US FDA to obtain approval for an oral version (Rybelsus) of its injectable drug semaglutide (Ozempic) and it was approved in September of 2019. One formulation of the injectable form of semaglutide (Wegovy) was approved for use for long term weight loss by the US FDA in June 2021.
The newest class of mimetic drug targets both the GLP-1 pathway and GIP pathway. Tirzepatide is a once-a-week injected molecule that was approved for use in May 2022 by the US FDA. Average patient HbA1c levels of less than 7% were achieved within 7 weeks following the onset if tirzepatide therapy. In addition to serum glucose reduction, tirzepatide use is associated with a faster weight loss profile than other drugs in the GLP-1 mimetic family, such as with semaglutide.
The weight loss that is associated with the GLP-1R agonist class of drug is most likely to be the result of secondary effects such as gastrointestinal disturbances, nausea, and other impediments to the desire to consume food. However, some evidence suggests that suppression of feeding behavior by GLP-1R agonists may be exerted via increased hepatic FGF21 synthesis. The GLP-1R, present in glutamatergic neurons in hypothalamic nuclei such as the arcuate nucleus and the paraventricular nucleus (PVN), contributes to the increased hepatic FGF21 most likely via direct autonomic nervous system circuits from the brain to the liver. The increased expression of FGF21 induces a decrease in feeding desire, particularly for carbohydrate-rich foods.
Targeting DPP4
Although targeting compounds that can inhibit the enzymatic action of DPP4 would seem like ideal candidates for treating the hyperglycemia of uncontrolled diabetes, there are several unknowns associated with DPP4 inhibition. One of these issues is the fact that GLP-1 and GIP are only two of the many known substrates for DPP4 cleavage. Thus, prolonged inhibition of DPP4 enzymatic activity may have unexpected consequences unrelated to control of hyperglycemia. Most of the drugs that have been developed as DPP4 inhibitors are given names that include the suffix “-gliptin“.
Despite the potential for as yet unknown effects, the DDP4 inhibitor developed by Merck, Januvia® (sitagliptin), has been approved for use alone or in combination with either metformin or the thiazolidinediones. Treatment of patients with Januvia as the only therapeutic agent for 18 weeks produced significant reductions of HbA1c, along with an improvement of β-cell function and no change in body weight.
A second generation DPP4 inhibitor developed by Novartis called Glavus® (vildagliptin) has recently received approvable status from the US FDA. Glavus administration is associated with significantly increased pancreatic β-cell function and reduced HbA1c levels without hypoglycemia or other adverse events. Another drug in the DPP4 inhibitor class to receive US FDA approval is Onglyza® (saxagliptin) made by AstraZeneca and Bristol-Myers Squibb. Onglyza is designed as a once-daily orally administered tablet.
DPP4 was originally identified as the lymphocyte cell surface antigen CD26. In humans CD26 functions in many pathways that are not directly related to its peptidase activity. It harbors adenosine deaminase-binding (ADA-binding) properties and is involved in extracellular matrix binding. Of importance to the immune system, CD26 expression and activity are enhanced upon T-cell activation. CD26 interacts with other lymphocyte cell surface antigens including ADA, CD45 and the chemokine receptor CXCR4 (notable is the fact that CXCR4 is a T-cell attachment site for HIV). Currently available data indicates that the peptidase activity of DPP4 is independent of the T-cell activating and co-stimulatory functions assigned to CD26. Of significance, however, is that in gene knock-out mice lacking CD26 there is enhanced insulin secretion and improved glucose tolerance.
The major clinical advantages to the use of DPP4 inhibitors is that the ones in use or in current trials are orally delivered. Compliance in patients is much higher with orally delivered drugs than with those that require injection.
Biguanides (Metformin)
The biguanides are a class of drug that functions to lower serum glucose levels by enhancing insulin-mediated suppression of hepatic glucose production and enhancing insulin-stimulated glucose uptake by skeletal muscle. Metformin (Glucophage®) is a member of this class and is currently the most widely prescribed insulin-sensitizing drug in current clinical use, world-wide.
Metformin administration does not lead to increased insulin release from the pancreas and as such the risk of hypoglycemia is minimal. Because the major site of action for metformin is the liver its use can be contraindicated in patients with liver dysfunction. The drug is ideal for obese patients and for younger type 2 diabetics.
A structurally related drug, phenformin, was removed from use in the treatment of diabetes in the US in 1977 due to an increased risk for lactic acidosis.
Evidence on the mode of action of metformin shows that it improves insulin sensitivity by increasing insulin receptor tyrosine kinase activity and enhancing glycogen synthesis in hepatocytes, and by increasing recruitment and transport of GLUT4 transporters to the plasma membrane in adipose tissue. Additionally, it has been shown that metformin affects mitochondrial activities dependent upon the model system studied. Metformin has a mild inhibitory effect on complex I of oxidative phosphorylation, has antioxidant properties, and activates both glucose-6-phosphate dehydrogenase (G6PD; also identified as G6PDH) and AMP-activated protein kinase (AMPK).
The importance of AMPK in the actions of metformin stems from the role of AMPK in the regulation of both lipid and carbohydrate metabolism. Go to the AMPK: Master Metabolic Regulator page for more details. In adipose tissue, metformin inhibits lipolysis while enhancing re-esterification of fatty acids.
The activation of AMPK by metformin occurs, in part, through the inhibitory effects of the drug on complex I of oxidative phosphorylation. This leads to a reduction in ATP production and, therefore, an increase in the level of AMP and as a result activation of AMPK. In fact, since the cells of the gut will see the highest doses of metformin they will experience the greatest level of inhibited complex I which may explain the gastrointestinal side effects (nausea, diarrhea, anorexia) of the drug that limit its utility in many patients.
Recent research has demonstrated that metformin directly activates AMPK in both a dose- and time-dependent manner which in turn inhibits the mechanistic target of rapamycin complex 1 (mTORC1). The mTORC1 is a key regulator of protein synthesis, cellular responses to energy depletion, and control of autophagy.
Within hepatocytes, the metformin-mediated activation of AMPK results in suppression of both glycogenolysis and gluconeogenesis, effects that limit glucose output by the liver. These effects of AMPK are, in part, due to the phosphorylation and activation of the cyclic nucleotide phosphodiesterase, PDE4B. Activation of hepatic PDE4B results in the metabolism of cAMP, thereby resulting in reduced activation of PKA.
Metformin has also been shown to inhibit the activation of the transcription factor identified as p52. The p52 protein is derived from the mRNA transcribed from the NFKB2 gene which encodes a subunit of the NFκB (nuclear factor-kappa-B) complex. The full-length p100 protein encoded by the NFKB2-derived mRNA is post-translationally processed into the active p52 form. Depending upon the proteins to which p52 dimerizes it can function as a transcriptional activator or repressor. One important gene whose transcription is repressed by p52 is PDE4B. Thus, the inhibition of p52 by metformin results in the ability of the PDE4B gene to remain transcriptionally active leading to reductions in the level of cAMP and reduced activation of PKA.
When active, PKA will phosphorylate and activate phosphorylase kinase (encoded by the PHK gene). Phosphorylase kinase predominantly phosphorylates and activates glycogen phosphorylase, the enzyme responsible for removal of glucose from glycogen. In addition, phosphorylase kinase is one of the enzymes that phosphorylates and inhibits glycogen synthase. Therefore, at the level of hepatic glycogen homeostasis metformin promotes glucose storage in glycogen and reduces glucose release from glycogen.
Other key substrates for PKA that regulate hepatic glucose homeostasis include PFK-2 and pyruvate kinase (PK). Phosphorylation of PFK-2 by PKA results in the stimulation of gluconeogenesis while phosphorylation of PK by PKA results in inhibition of glycolysis. Thus, at the level of overall glucose homeostasis the AMPK-mediated activation of PDE4B will counter all of the cAMP-PKA-mediated effects in hepatocytes that are stimulated by glucagon as well as those exerted by epinephrine binding to hepatic β2-adrenergic receptors.
In addition to complex I and AMPK, additional direct targets for metformin action have been identified. The arachidonic acid epoxygenase, encoded by the CYP3A4 gene, has been shown to bind metformin which results in inhibition of the enzyme. Clinical significance of this inhibition is demonstrated by the fact that inhibition of CYP3A4 by metformin results in reduced mitochondrial respiration leading to reductions in cancer cell growth.
Based upon crystallographic analysis of metformin interaction with known direct targets, such as CYP3A4, computational studies have suggested that there may be as many as 40 proteins that are direct targets for the action of metformin. These putative direct targets include the mitochondria-localized isoform of glycerol-3-phosphate dehydrogenase (encoded by the GPD2 gene), the mitochondria-localized isoform of serine hydroxymethyltransferase (encoded by the SHMT2 gene), presenilin enhancer, gamma-secretase subunit (commonly identified as PEN2; encoded by the PSENEN gene), high mobility group box 1 (encoded by the HMGB1 gene), and lysine demethylase 6A (encoded by the KDM6A gene). The latter two proteins are involved in inflammatory processes and binding to these proteins is likely to be associated with the observed anti-inflammatory and immunomodulatory effects of metformin.
The fact that computational studies indicate that metformin likely binds to the mitochondria-localized isoform of glycerol-3-phosphate dehydrogenase is significant given that previous studies had demonstrated gluconeogenesis was suppressed by metformin via inhibition of the GPD2 encoded enzyme. These studies showed that the effects of metformin on gluconeogenesis were essentially identical to the consequences of Gpd2 knock-out in mice.
In adolescent females with type 2 diabetes, the use of metformin is highly recommended to reduce the incidence as well as the potential for polycystic ovarian syndrome, PCOS. PCOS is brought on by the hyperinsulinemia of type 2 diabetes. Insulin effects on the ovary drive conversion of progesterone to testosterone and a reduction in serum hormone binding globulin (SHBG). Taken together, the effects of hyperinsulinemia lead to a hyperandrogenic state in the ovary resulting in follicular atresia and ovulatory dysfunction.
Similar to the re-identification of NAFLD as MASLD due to the realization of the broad metabolic dysfunction of the disorder, PCOS has also undergone a re-imagining of the best way to describe the disorder. It has long been understood that PCOS, as a disorder, is much more than just pathological ovarian cysts and in fact encompasses diverse endocrine and metabolic features and that these features contribute to delayed definitive diagnosis and a resulting fragmentation in delivery of care. As a result it has been suggested that a more useful and informative descriptor for this disorder should be polyendocrine metabolic ovarian syndrome (PMOS).
In addition to its effects on hepatic glucose and lipid homeostasis and adipose tissue lipid homeostasis, metformin exerts effects in the intestines, pancreas, vascular endothelial cells, and in cancer cells. The latter effects of metformin were recognized in epidemiological studies of diabetic patients taking metformin versus those who were taking another anti-hyperglycemia drug.
At the level of the intestines, a major positive effect of metformin is increased transport of glucose from the blood to the intestinal lumen. This movement of glucose, in the direction opposite to dietary absorption, contributes to significant reductions in blood glucose levels.
Metformin use is also associated with modulation of energy balance resulting in weight loss. The ability of metformin to induce weight loss is not directly related to an increase in energy expenditure nor to changes in nutrient absorption but is due to suppression of the desire for food intake. Recently (2024) it was demonstrated that the ability of metformin to suppress food intake is due to the induction of the production of the anorexigenic metabolite, N-lactoyl-phenylalanine (Lac-Phe). With respect to metformin induction of Lac-Phe production it is intestinal epithelial cells that are the source. The increase in Lac-Phe production induced by metformin is directly related to the inhibition of complex I of the oxidative phosphorylation machinery. The decrease in complex I activity drives an increase in glycolysis which in turn results in increased lactate production in intestinal epithelial cells and, in turn, increased Lac-Phe synthesis.
The major negative effect of long-term metformin use is vitamin B12 deficiency. This is especially problematic in pregnant females. However, recognition of this issue and supplementation with B12 prior to, and during, the use of metformin in pregnant women can completely mitigate any potential for B12 deficiency.
Metformin and Longevity
Anti-Cancer Activity of Metformin
Sulfonylureas
The sulfonylurea and meglitinide classes of oral hypoglycemic drugs are referred to as endogenous insulin secretagogues because they induce the pancreatic release of endogenous insulin.
The sulfonylureas have been used in the US for nearly 50 years. The first generation sulfonylureas (tolbutamide, acetohexamide, chlorpropramide and tolazamide) are not routinely prescribed any longer in the US. The second generation sulfonylureas include glipizide (Glucotrol®), glimepiride (Amaryl®) and glyburide (DiaBeta®, Micronase®, Glynase®). Because all of these drugs can induce pronounced hypoglycemia, treatment is initiated with the lowest possible dose and carefully monitored until the dose is found that results in a fasting plasma glucose (FPG) of 110-140mg/dL. Sulfonylureas function by binding to and inhibiting the pancreatic ATP-dependent potassium channel that is normally involved in glucose-mediated insulin secretion (see Insulin Function, Insulin Resistance, and Food Intake Control of Secretion page for more details). Sulfonylureas have no significant effects on circulating triglycerides, lipoproteins or cholesterol.
Meglitinides
As indicated, the meglitinides repaglinide (Prandin®) and nateglinide (Starlix®) are non-sulfonylurea insulin secretagogues that are both fast acting and of short duration. Like the sulfonylureas, meglitinide therapy results in significant reduction in fasting plasma glucose (FPG) as well as glycated hemoglobin (HbA1c). The mechanism of action of the meglitinides is initiated by binding to a receptor on the pancreatic β-cell that is distinct from the receptors for the sulfonylureas. However, meglitinides do exert effects on potassium conductance. Like the sulfonylureas, the meglitinides have no direct effects on the circulating levels of plasma lipids.
α-Glucosidase inhibitors
The α-glucosidase inhibitors such as acarbose (Precose®) and miglitol (Glyset®) function by interfering with the action of the α-glucosidases present in the small intestinal brush border. The consequence of this inhibition is a reduction in digestion and the consequent absorption of glucose into the systemic circulation. The reduction in glucose uptake allows the pancreatic β-cells to more effectively regulate insulin secretion. The advantage to the use of the α-glucosidase inhibitors is that they function locally in the intestine and have no major systemic action. Hypoglycemia does not usually occur with the use of α-glucosidase inhibitors but they are effective at reducing fasting plasma glucose (FPG) levels and levels of glycated hemoglobin (HbA1c). The common adverse side effects of these inhibitors are abdominal bloating and discomfort, diarrhea and flatulence.
SGLT2 Antagonists
A new class of orally administered compounds that targets renal glucose transport and inducers of glucosuria are currently being tested for efficacy in type 2 diabetes treatment. In the kidney, glucose is filtered at the glomerulus and then reabsorbed via active transport in the proximal convoluted tubule. Two sodium-glucose co-transporters (SGLT1 and SGLT2) have been identified as responsible for this renal glucose reabsorption. The SGLT proteins are members of the solute carrier 5 family of membrane transporters, and thus, SGLT1 is SLC5A1 and SGLT2 is SLC5A2. SGLT1 is expressed in several tissues, with highest levels of expression in the small intestine where its primary function is in glucose and galactose absorption.
SGLT2 is expressed nearly exclusively in the apical membranes of epithelial cells of the proximal tubule of the kidney and has been shown to be responsible for approximately 90% of the renal glucose reabsorption (see Figure below). Therefore, it is postulated that selective inhibition of the renal SGLT2 activity should result in greatly enhanced glucose release in the urine. Several drugs (all of which carry the suffix “-gliflozin“: empagliflozin, canagliflozin, dapagliflozin, ertuglifozin, ipragliflozin) that inhibit SGLT2 have been developed. Canagliflozin (Invokana), dapagliflozin (Farxiga), empagliflozin (Jardiance), and ertugliflozin (Steglatro) are the only drugs in this class currently approved by the US FDA for the treatment of type 2 diabetes. The advantage of these drugs is that they are taken orally so compliance will be higher than injected type 2 diabetes drugs. In addition, these drugs are formulated as once-a-day tablets.
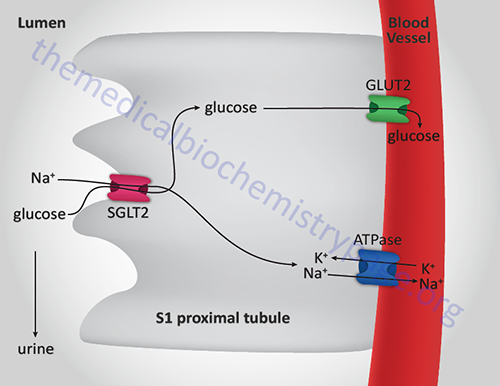
In addition to the obvious benefit of SGLT2 inhibitors with respect to blood glucose levels in diabetes, these drugs have also been shown to exert benefits in the liver. Associated with the development and progression of metabolic dysfunction-associated fatty liver disease (MAFLD) is the accumulation of CD8+ T cells. The accumulation of these T cells in the liver is a significant contributor to liver inflammation and injury, ultimately leading to metabolic dysfunction-associated steatohepatitis (MASH). MAFLD is also referred to as metabolic dysfunction-associated steatotic liver disease, MASLD. MAFLD was formerly referred to as non-alcoholic fatty liver disease, NAFLD.
The SGLT2 inhibitor, empagliflozin, has been shown to exert beneficial effects with respect to liver steatosis. Recent research has found that the positive hepatic effects of empagliflozin are exerted at the level of the CD8+ T cells. Empagliflozin activates the expression of the BDH1 gene which encodes the enzyme β-hydroxybutyrate dehydrogenase (3-hydroxybutyrate dehydrogenase) involved in the synthesis of the ketone body, β-hydroxybutyrate (BHB) from acetoacetate. BHB inhibits the transcription factor, interferon regulatory factor 4, which plays a critical role in the activation of CD8+ T cells. Reduced activation of CD8+ T cells significantly improves liver status in patients with MASH.
New Frontiers in Diabetes Therapy
Several new approaches are being taken in the search for treatments for diabetes. These include the development of newer drugs that target the same pathways as described in the sections above including, but not limited to, new classes of DPP4 antagonists and GLP-1 receptor agonists. Additional potentially targets include the liver-derived growth factor, fibroblast growth factor 21 (FGF21), the NAD+-dependent deacetylase SIRT1 or sirtuin 1, and the lipid binding G-protein coupled receptor identified as GPR119.
Given that excess free fatty acid (FFA) accumulation in hepatocytes and skeletal muscle is a major inducer of insulin resistance, several mediators of hepatic lipogenesis and skeletal muscle fatty acid oxidation have been identified as potential therapeutic targets. These targets include ACC2 and diacylglycerol acyltransferase 2 (DGAT2).
FGF21 Agonists
Hepatic lipid homeostasis is tightly controlled through the influences of insulin, free fatty acids, sterol regulated element-binding protein (SREBP), and nuclear receptors and associated regulatory molecules such as the liver X receptors (LXRs) and peroxisome proliferator-activated receptor α (PPARα), respectively. The LXRs are members of the steroid/thyroid hormone superfamily of cytosolic ligand binding receptors that migrate to the nucleus upon ligand binding and regulate gene expression by binding to specific target sequences. There are two forms of the LXRs, LXRα and LXRβ. The LXRs form heterodimers with the retinoid X receptors (RXRs) and as such can regulate gene expression either upon binding oxysterols (e.g. 22R-hydroxycholesterol) or 9-cis-retinoic acid.
Recent evidence demonstrated that expression of the fibroblast growth factor family member, FGF21, was significantly elevated in mice fed a high-fat, low-carbohydrate ketogenic diet. Additionally, in mice with experimentally induced reduction in FGF21 expression there was an associated lipemia, reduced ketogenesis, and a resultant fatty liver. Conversely, administration of FGF21 to diabetic animals resulted in reductions in the levels of fasting glucose and serum lipids. These results indicate that FGF21 plays a key role in regulating the expression of genes involved in hepatic lipid homeostasis and that activation of FGF21 activity could prove to be a significant tool in the treatment of the disrupted metabolic status in diabetic individuals.
SIRT1 Agonists
SIRT1 or sirtuin 1 is the homolog of the yeast (S. cerevisiae) Sir2 gene (Sir refers to Silent mating type Information Regulator). SIRT1 is a member of the sirtuin family of proteins (seven members; SIRT1 through SIRT7) that are characterized by a sirtuin core domain and grouped into four classes. SIRT1 is an NAD+-dependent deacetylase that modulates the activities of proteins that are in pathways downstream of the beneficial effects of calorie restriction. The yeast sirtuin proteins are known to regulate life-span extension, epigenetic gene silencing, and to suppress recombination of ribosomal DNA (rDNA).
SIRT1 catalyzes a reaction where hydrolysis of NAD+ is coupled to the deacetylation of acetylated lysines in target proteins. These target proteins include histones, transcription factors and transcription factor co-regulators. The NAD+ is hydrolyzed to nicotinamide (which is a strong inhibitor of SIRT1 activity) and O-acetyl-ADP ribose. Principal pathways involved in glucose homeostasis and insulin sensitivity are affected by SIRT1 activity. In skeletal muscle, a major site of insulin-induced glucose uptake, SIRT1 and AMPK work in concert to increase the rate of fatty acid oxidation in periods of decreased nutrient availability.
The plant-derived compound, resveratrol (a polyphenolic compound), is a known activator of SIRT1 function. The effects of resveratrol have been shown to increase mitochondrial content, ameliorate insulin resistance, and prolong survival in laboratory mice fed a high-fat diet. Recent studies on the action of SIRT1 agonists have demonstrated that compounds that activate SIRT1, but that are structurally unrelated to resveratrol, also improve insulin sensitivity in adipose tissue, liver, and skeletal muscle resulting in lower plasma glucose. The actions of these compounds in laboratory studies indicate the potential efficacy of a therapeutic approach to type 2 diabetes that includes activators of SIRT1 activity.
GPR119 Agonists
The fatty acid-sensing receptor, GPR119, is a Gs-type G-protein coupled receptor. GPR119 is expressed at the highest levels in the pancreas and fetal liver with expression also seen in the gastrointestinal tract, specifically the ileum and colon. GPR119 is a member of the class A family (rhodopsin-type) of GPCR. GPR119 binds long-chain fatty acids including oleoylethanolamide (OEA), lysophosphatidylcholine (LPC), various lipid amides, and retinoic acid. OEA is the most potent ligand and likely represents the endogenous ligand for GPR119.
The demonstration that OEA is the most active endogenous ligand for GPR119 is of particular interest since previous work has demonstrated that OEA, when administered to laboratory animals, causes a significant reduction in food intake and body weight gain. These effects of OEA are the result of the activation of the nuclear receptor PPARα, increased expression of fatty acid translocase, and modification of feeding behavior and motor activity. In addition, activation of GPR119 in the pancreas is correlated with enhanced glucose-stimulated insulin secretion (GSIS) and activation of the receptor in the gut results in increased secretion of the incretin hormones GLP-1 and GIP.
These observations indicate that GPR119 activation is associated with a dual mechanism of reducing blood glucose: acting directly through pancreatic β-cells to promote GSIS and in the gut via the stimulation of the incretins GLP1 and GIP both of which increase insulin release from the pancreas in response to food intake. Currently there are several small molecule agonists of GPR119 in clinical trials being tested for their efficacy in treating the hyperglycemia of type 2 diabetes as well as for their efficacy in treating obesity.